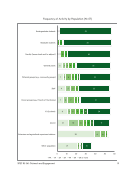
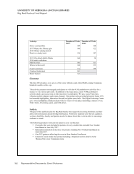
80 Survey Results: Survey Questions and Responses In our standard event survey, we ask, “If you are from the university, which department are you affiliated with?” We use this information to identify who we are and are not reaching. We also ask, “How did you hear about this event?” which helps us in planning our promotional efforts. And “How could this event have been better?” Information on promotion outlets Libraries’ office in residence hall Monitoring and tracking our social media following (users, likes, shares, followers, reach, etc.) has enabled us to better develop and target content (e.g., for paid ads on social media). Mostly qualitative data such as evaluation forms Observation and surveys Observational data, headcounts, requests for materials. Not all activities (e.g., types of games at wellness stations during exams) work in the different library locations. Changes made to reflect use and engagement at the different libraries. Observational, comments, room sizes, usage statistics, and web counts Observational, headcount, and participant surveys Observations, comments Participant comments (usually written feedback forms) Qualitative data from a variety of sources combined with usage/attendance data has shaped space planning and development. Responses on minute papers (workshops and classes) feedback at registration or end of the session evaluation of outreach strategies alongside attendance to see what was effective. Statistics related to usage and/or attendance, especially related to days and times of events. Student feedback trends over time Survey responses Surveys from past events The success of our summer internship program in 2017 (as indicated in the surveys from the interns, mentors, and supervisors), led to us doubling the program in 2018. This happens frequently so we can improve our outreach and events. We use feedback from users, student and faculty surveys, targeted focus groups, post-outreach/program assessments (e.g., feedback, post-event surveys, feedback forms). Traffic, survey, and observational data have been used to make decisions about overnight library hours. User satisfaction from formal and informal feedback, surveys, engagement/attendance data, social media data We decided to have these breaks only during finals and added food, massage chairs, yoga, and mindfulness sessions. We have made substantive changes to the Author Talks series based on assessment data (expanding the scope to include non-university authors, for example). Also, our celebration of books has been tweaked over the years to include more types of scholarship and to be a local event in response to survey and feedback from attendees. We have scaled back our outreach services around the IR based on a faculty focus group and assessment about faculty investment in our IR.
Help