SPEC Kit 322: Library User Experience · 113
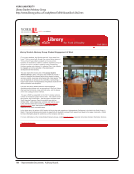
Duke University
Heatmaps of Key Library Pages: Spring 2011
http://library.duke.edu/about/assessment/web/heatmaps-spring2011.html
Heatmaps of Key Library Pages: Spring 2011
http://library.duke.edu/about/assessment/web/heatmaps-spring2011.html[5/27/11 12:06:24 PM]
Hours |Directions |About |Staff
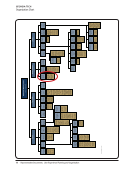
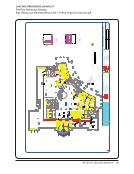
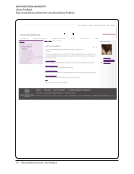
Library Homepage: March 21–25
Sample of 40,000 clicks made during the week of March 21, 2011
View large image
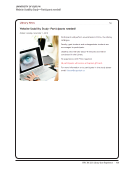
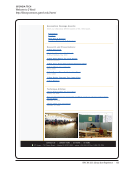
Interlibrary Loan page: March 28–30
Sample of 500 clicks during week of March 28, 2011
View large image
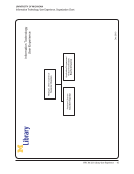
Special Collections Homepage: April 4–8
Sample of 800 clicks during week of April 4, 2011
View large image
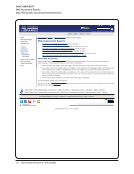
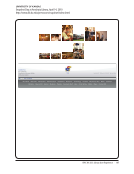
Data &GIS Homepage: April 11–15
Catalog |Articles |Databases |News
Duke Libraries About Us Library Assessment Web Assessment Reports
Heatmaps of Key Library Pages: Spring 2011
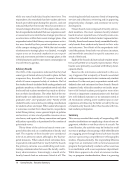
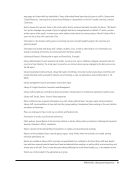
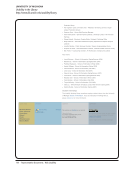
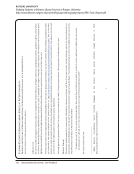
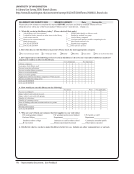
What is this? This page presents heatmaps showing usage trends on several library web pages during spring 2011.
What is a heatmap? Heatmaps are a graphical representation of where patrons clicked when visiting a web page. Cool colors mean fewer clicks, and warm colors
mean more clicks.
How did we make heatmaps? We followed steps outlined in the blog post "The definitive heatmap" to create our heatmaps. This method uses javascript, Ruby and
RMagick.
Duke University
Heatmaps of Key Library Pages: Spring 2011
http://library.duke.edu/about/assessment/web/heatmaps-spring2011.html
Heatmaps of Key Library Pages: Spring 2011
http://library.duke.edu/about/assessment/web/heatmaps-spring2011.html[5/27/11 12:06:24 PM]
Hours |Directions |About |Staff
Library Homepage: March 21–25
Sample of 40,000 clicks made during the week of March 21, 2011
View large image
Interlibrary Loan page: March 28–30
Sample of 500 clicks during week of March 28, 2011
View large image
Special Collections Homepage: April 4–8
Sample of 800 clicks during week of April 4, 2011
View large image
Data &GIS Homepage: April 11–15
Catalog |Articles |Databases |News
Duke Libraries About Us Library Assessment Web Assessment Reports
Heatmaps of Key Library Pages: Spring 2011
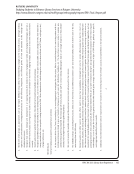
What is this? This page presents heatmaps showing usage trends on several library web pages during spring 2011.
What is a heatmap? Heatmaps are a graphical representation of where patrons clicked when visiting a web page. Cool colors mean fewer clicks, and warm colors
mean more clicks.
How did we make heatmaps? We followed steps outlined in the blog post "The definitive heatmap" to create our heatmaps. This method uses javascript, Ruby and
RMagick.