8
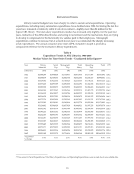
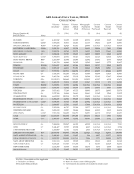
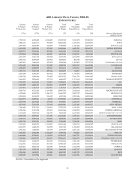
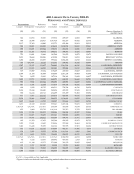
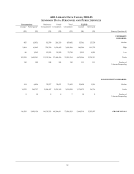
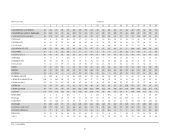
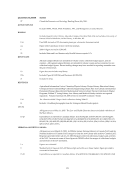
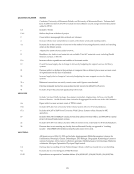
Table 1
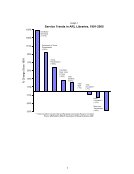
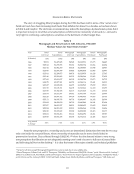
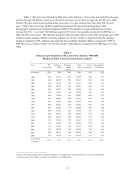
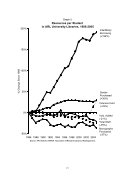
Service Trends in ARL Libraries, 1991‐2005
Median Values for Time‐Series Trends12
Year ILL:
Borrowed
Group
Pres.
Participants
In Group
Pres.
Reference
Trans.
Initial
Circ.
Total
Circ.
Ratio of
Initial to
Total Circ.
Total
Staff
Total
Students
(Libraries) (103) (84) (82) (80) (36) (80) (34) (105) (103)
1991 10,397 508 7,137 128,272 296,964 509,673 1.26 271 18,290
1992 11,362 526 7,154 132,562 342,989 554,579 1.27 265 18,273
1993 12,489 616 7,688 137,580 343,293 568,628 1.32 262 18,450
1994 14,007 568 7,831 150,144 369,996 572,749 1.31 264 18,305
1995 14,472 687 8,461 148,175 347,144 578,989 1.32 267 18,209
1996 15,278 719 8,410 156,306 336,481 560,244 1.39 264 18,320
1997 16,264 687 9,218 152,164 348,157 542,438 1.37 273 18,166
1998 17,656 698 9,462 134,944 354,924 514,574 1.37 273 18,335
1999 18,942 711 9,406 129,089 300,923 514,087 1.38 277 18,609
2000 20,475 722 9,596 117,027 273,231 482,542 1.42 267 18,908
2001 21,902 669 10,121 104,744 265,195 467,277 1.48 269 19,102
2002 21,339 776 11,350 96,829 251,146 462,223 1.51 279 19,925
2003 22,146 806 12,516 91,093 248,689 479,733 1.57 277 21,132
2004 25,737 757 12,864 85,478 261,526 496,369 1.60 273 21,562
2005 25,729 803 13,782 66,300 250,971 473,216 1.58 267 22,047
Avg annual
%change
6.7% 3.3% 4.8% -4.6% -1.2% -0.5% 1.6% -0.1% 1.3%
12 Series for Interlibrary Borrowing, Group Presentations, Participants in Group Presentations, Reference Transactions, Total
Circulation, and Total Students revised due to unavailable data.
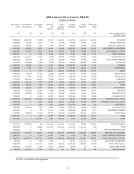
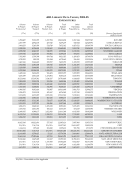
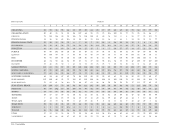
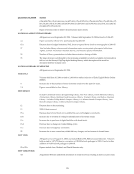
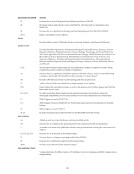
Table 1
Service Trends in ARL Libraries, 1991‐2005
Median Values for Time‐Series Trends12
Year ILL:
Borrowed
Group
Pres.
Participants
In Group
Pres.
Reference
Trans.
Initial
Circ.
Total
Circ.
Ratio of
Initial to
Total Circ.
Total
Staff
Total
Students
(Libraries) (103) (84) (82) (80) (36) (80) (34) (105) (103)
1991 10,397 508 7,137 128,272 296,964 509,673 1.26 271 18,290
1992 11,362 526 7,154 132,562 342,989 554,579 1.27 265 18,273
1993 12,489 616 7,688 137,580 343,293 568,628 1.32 262 18,450
1994 14,007 568 7,831 150,144 369,996 572,749 1.31 264 18,305
1995 14,472 687 8,461 148,175 347,144 578,989 1.32 267 18,209
1996 15,278 719 8,410 156,306 336,481 560,244 1.39 264 18,320
1997 16,264 687 9,218 152,164 348,157 542,438 1.37 273 18,166
1998 17,656 698 9,462 134,944 354,924 514,574 1.37 273 18,335
1999 18,942 711 9,406 129,089 300,923 514,087 1.38 277 18,609
2000 20,475 722 9,596 117,027 273,231 482,542 1.42 267 18,908
2001 21,902 669 10,121 104,744 265,195 467,277 1.48 269 19,102
2002 21,339 776 11,350 96,829 251,146 462,223 1.51 279 19,925
2003 22,146 806 12,516 91,093 248,689 479,733 1.57 277 21,132
2004 25,737 757 12,864 85,478 261,526 496,369 1.60 273 21,562
2005 25,729 803 13,782 66,300 250,971 473,216 1.58 267 22,047
Avg annual
%change
6.7% 3.3% 4.8% -4.6% -1.2% -0.5% 1.6% -0.1% 1.3%
12 Series for Interlibrary Borrowing, Group Presentations, Participants in Group Presentations, Reference Transactions, Total
Circulation, and Total Students revised due to unavailable data.