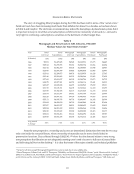
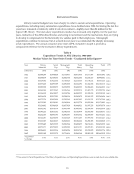
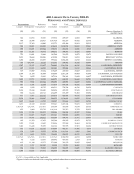
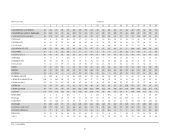
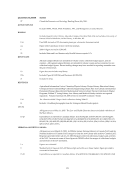
21 TABLE
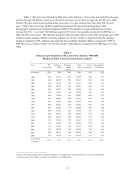
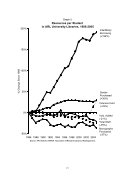
7
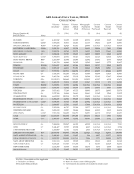
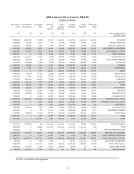
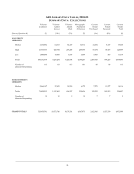
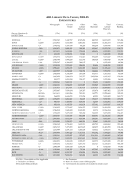
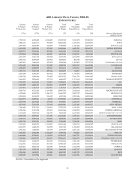
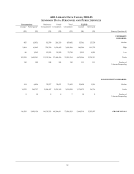
ELECTRONIC
RESOURCES
AND MATERIALS
EXPENDITURESIN
ARL UNIVERSITY
LIBRARIES,1992-2005
1992-93
1993-94
1994-95
1995-96
1996-97
1997-98
1998-99
1999-2000*
2000-01
2001-02*
2002-03
2003-04
2004-05
a. Computer
File Expenditures
(monographic/onetime)
Total
14,147,625
20,132,553
22,030,727
24,639,822
8,013,055
11,189,103
10,848,219
14,727,984
15,297,096
16,748,194
23,275,683
32,098,404
38,744,076
Average
172,532
236,854
247,536
262,126
87,098
122,957
121,890
161,846
159,345
167,482
225,978
314,690
372,539
Median
148,158
212,936
217,988
219,178
47,932
52,311
54,024
98,657
72,070
82,566
111,266
191,148
210,576
N
85
89
94
92
91
89
91
96
100
103
102
104
b. Electronic
Serial Expenditures
Total
N/A
N/A
11,847,577
15,170,971
40,956,696
49,497,141
67,124,554
84,343,868
117,415,618
154,418,679
205,300,292
269,601,241
328,166,027
Average
N/A
N/A
188,057
194,500
401,536
494,971
639,281
818,873
1,118,244
1,429,803
1,849,552
2,450,920
3,038,574
Median
N/A
N/A
156,754
172,805
355,922
426,722
571,790
736,317
992,067
1,272,965
1,649,361
2,348,463
2,824,962
N
63
78
102
100
105
103
105
108
111
110
108
c. Total
Electronic
Resources
(Total
a+b)
Total
14,147,625
20,132,553
33,878,304
39,810,793
50,512,984
60,686,244
77,972,773
99,071,852
132,712,714
171,166,873
228,575,974
301,699,645
366,910,103
Average
172,532
236,854
349,261
394,166
485,702
594,963
742,598
943,541
1,252,007
1,556,062
2,059,243
2,718,015
3,366,147
Median
148,158
212,936
278,404
332,128
420,741
495,011
645,495
931,210
1,129,298
1,377,874
1,775,865
2,705,847
3,144,841
N
82
85
97
101
104
102
105
105
106
110
111
111
109
Total
Library
Materials
Expenditures
28
Total
393,271,073
425,287,651
526,496,347
571,145,986
642,123,715
664,600,663
727,623,160
773,321,519
828,778,808
910,930,849
950,275,167
1,016,121,605
1,031,619,722
Average
4,795,989
5,003,384
5,427,797
5,654,911
6,174,266
6,515,692
6,929,744
7,364,967
7,818,668
8,281,189
8,561,038
9,154,249
9,464,401
Median
4,242,887
4,527,122
4,714,384
4,975,353
5,529,606
5,643,070
5,991,177
6,545,146
7,028,134
7,566,727
7,707,153
8,276,175
8,662,668
N
82
85
97
101
104
102
105
105
106
110
111
111
109
Electronic
Resources
Expenditures
as
a Percent
of Total
Materials
Expenditures
Average
3.60
4.75
6.39
6.83
7.76
8.85
10.56
12.88
16.25
19.60
25.02
31.33
37.46
Median
N/A
4.45
5.33
6.42
7.51
8.29
10.18
12.75
14.80
18.15
22.01
29.81
37.53
N
82
85
97
101
104
102
105
105
106
110
111
111
109
Expenditures
for Bibliographic
Utilities,
Networks,
etc. (External)
Total
N/A
N/A
N/A
N/A
$3,827,348
4,695,737
7,442,962
9,523,348
14,655,078
20,373,560
21,470,716
17,420,520
16,082,790+
Average
N/A
N/A
N/A
N/A
$136,691
142,295
201,161
250,614
311,810
424,449
438,178
335,010
349,626+
Median
N/A
N/A
N/A
N/A
$120,096
128,795
145,280
204,598
198,289
336,690
250,000
94,837
149,396+
N
28
33
37
38
47
48
49
52
46+
28 Figures
reflect
Materials
Expenditures
only
from
those institutions
that reported
nonzero
figures
for Total Electronic
Resources.
*In
a recent
review
of past Supplementary
Statistics
data,
some
figures
previously
published
in these
columns
were
found
to
be incorrect
and subsequently
revised.
+Includes
only
nonzero
responses,
to
be consistent
with
past Supplementary
Statistics
reporting.
Statistics
that
include
zeroes
can
be found
on
page
51.
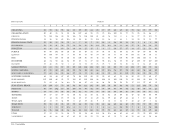
7
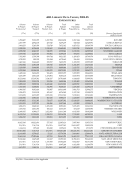
ELECTRONIC
RESOURCES
AND MATERIALS
EXPENDITURESIN
ARL UNIVERSITY
LIBRARIES,1992-2005
1992-93
1993-94
1994-95
1995-96
1996-97
1997-98
1998-99
1999-2000*
2000-01
2001-02*
2002-03
2003-04
2004-05
a. Computer
File Expenditures
(monographic/onetime)
Total
14,147,625
20,132,553
22,030,727
24,639,822
8,013,055
11,189,103
10,848,219
14,727,984
15,297,096
16,748,194
23,275,683
32,098,404
38,744,076
Average
172,532
236,854
247,536
262,126
87,098
122,957
121,890
161,846
159,345
167,482
225,978
314,690
372,539
Median
148,158
212,936
217,988
219,178
47,932
52,311
54,024
98,657
72,070
82,566
111,266
191,148
210,576
N
85
89
94
92
91
89
91
96
100
103
102
104
b. Electronic
Serial Expenditures
Total
N/A
N/A
11,847,577
15,170,971
40,956,696
49,497,141
67,124,554
84,343,868
117,415,618
154,418,679
205,300,292
269,601,241
328,166,027
Average
N/A
N/A
188,057
194,500
401,536
494,971
639,281
818,873
1,118,244
1,429,803
1,849,552
2,450,920
3,038,574
Median
N/A
N/A
156,754
172,805
355,922
426,722
571,790
736,317
992,067
1,272,965
1,649,361
2,348,463
2,824,962
N
63
78
102
100
105
103
105
108
111
110
108
c. Total
Electronic
Resources
(Total
a+b)
Total
14,147,625
20,132,553
33,878,304
39,810,793
50,512,984
60,686,244
77,972,773
99,071,852
132,712,714
171,166,873
228,575,974
301,699,645
366,910,103
Average
172,532
236,854
349,261
394,166
485,702
594,963
742,598
943,541
1,252,007
1,556,062
2,059,243
2,718,015
3,366,147
Median
148,158
212,936
278,404
332,128
420,741
495,011
645,495
931,210
1,129,298
1,377,874
1,775,865
2,705,847
3,144,841
N
82
85
97
101
104
102
105
105
106
110
111
111
109
Total
Library
Materials
Expenditures
28
Total
393,271,073
425,287,651
526,496,347
571,145,986
642,123,715
664,600,663
727,623,160
773,321,519
828,778,808
910,930,849
950,275,167
1,016,121,605
1,031,619,722
Average
4,795,989
5,003,384
5,427,797
5,654,911
6,174,266
6,515,692
6,929,744
7,364,967
7,818,668
8,281,189
8,561,038
9,154,249
9,464,401
Median
4,242,887
4,527,122
4,714,384
4,975,353
5,529,606
5,643,070
5,991,177
6,545,146
7,028,134
7,566,727
7,707,153
8,276,175
8,662,668
N
82
85
97
101
104
102
105
105
106
110
111
111
109
Electronic
Resources
Expenditures
as
a Percent
of Total
Materials
Expenditures
Average
3.60
4.75
6.39
6.83
7.76
8.85
10.56
12.88
16.25
19.60
25.02
31.33
37.46
Median
N/A
4.45
5.33
6.42
7.51
8.29
10.18
12.75
14.80
18.15
22.01
29.81
37.53
N
82
85
97
101
104
102
105
105
106
110
111
111
109
Expenditures
for Bibliographic
Utilities,
Networks,
etc. (External)
Total
N/A
N/A
N/A
N/A
$3,827,348
4,695,737
7,442,962
9,523,348
14,655,078
20,373,560
21,470,716
17,420,520
16,082,790+
Average
N/A
N/A
N/A
N/A
$136,691
142,295
201,161
250,614
311,810
424,449
438,178
335,010
349,626+
Median
N/A
N/A
N/A
N/A
$120,096
128,795
145,280
204,598
198,289
336,690
250,000
94,837
149,396+
N
28
33
37
38
47
48
49
52
46+
28 Figures
reflect
Materials
Expenditures
only
from
those institutions
that reported
nonzero
figures
for Total Electronic
Resources.
*In
a recent
review
of past Supplementary
Statistics
data,
some
figures
previously
published
in these
columns
were
found
to
be incorrect
and subsequently
revised.
+Includes
only
nonzero
responses,
to
be consistent
with
past Supplementary
Statistics
reporting.
Statistics
that
include
zeroes
can
be found
on
page
51.