16
EXPENDITURE TRENDS
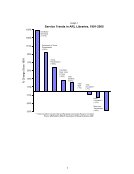
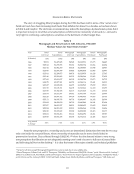
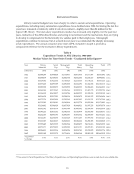
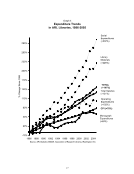
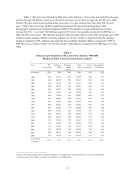
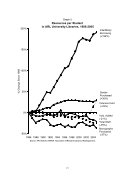
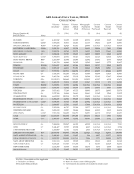
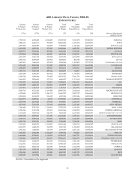
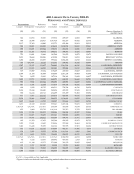
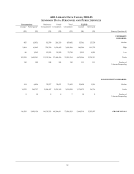
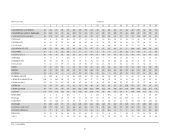
Library material budgets have risen sharply in order to sustain serial expenditures. Operating
expenditures, including many automation expenditures, have doubled since 1986, but during the last five
years have remained at relatively stable levels of investment—slightly more than $2 million for the
typical ARL library. The total salary expenditures median has increased only slightly over the past four
years, indicative of the difficulties libraries are having in recruitment and the mechanisms they are trying
to develop to compensate for the historically low salaries paid to their employees. Monograph
expenditures continue to increase, but at a much slower pace to accommodate the sharply increasing
serial expenditures. The annual consumer price index (CPI), included in Graph 4, provides a
comparative reference for the increases in library expenditures.
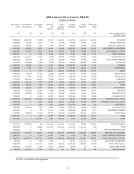
Table 4
Expenditure Trends in ARL Libraries, 1986‐2005
Median Values for Time‐Series Trends – Unadjusted dollar figures24
Year Library
Materials
Serial
Exp.
Monograph
Exp.
Total
Salary
Operating
Exp.
Total CPI
(Libraries) (105) (101) (98) (104) (104) (105)
1986 $2,705,297 $1,475,825 $1,118,931 $4,011,436 $1,111,914 $8,361,092 109.6
1987 $3,058,479 $1,769,353 $1,060,754 $4,361,646 $1,180,167 $8,990,001 113.6
1988 $3,369,896 $1,942,350 $1,109,845 $4,618,335 $1,198,674 $9,557,623 118.3
1989 $3,577,405 $2,097,789 $1,093,858 $5,236,292 $1,364,558 $10,183,315 124.0
1990 $3,903,358 $2,289,075 $1,329,950 $5,469,333 $1,386,618 $11,241,022 130.7
1991 $4,064,344 $2,519,065 $1,396,566 $5,885,814 $1,445,735 $11,990,794 136.2
1992 $4,156,510 $2,610,837 $1,348,786 $6,050,222 $1,390,245 $12,249,150 140.3
1993 $4,316,674 $2,917,381 $1,284,116 $5,962,470 $1,561,122 $12,265,696 144.5
1994 $4,572,276 $2,892,898 $1,282,569 $6,047,803 $1,676,701 $12,767,348 148.2
1995 $4,715,203 $3,128,181 $1,365,046 $6,312,770 $1,853,586 $13,171,893 152.4
1996 $5,126,482 $3,384,928 $1,437,028 $6,664,021 $1,997,233 $13,870,378 156.9
1997 $5,562,742 $3,610,714 $1,457,789 $6,893,582 $2,039,957 $14,526,674 160.5
1998 $5,795,223 $3,814,162 $1,486,436 $7,163,979 $2,072,903 $15,329,371 163.0
1999 $6,232,365 $4,093,793 $1,496,687 $7,476,532 $2,069,887 $16,737,261 166.6
2000 $6,744,281 $4,430,030 $1,645,248 $7,811,403 $1,991,852 $17,221,441 172.2
2001 $7,322,507 $4,610,327 $1,848,622 $8,106,666 $2,280,493 $17,620,048 177.5
2002 $7,599,249 $4,915,339 $1,806,964 $8,488,255 $2,136,616 $18,456,038 180.1
2003 $8,273,171 $5,372,822 $1,858,280 $8,813,191 $2,073,913 $19,030,188 183.9
2004 $8,286,431 $5,552,216 $1,824,296 $9,015,741 $2,274,878 $19,953,776 189.4
2005 $8,801,962 $5,933,378 $1,776,416 $9,268,364 $2,243,592 $20,663,012 195.4
Avg annual
%change
6.4% 7.6% 2.5% 4.5% 3.8% 4.9% 3.1%
24 Time series for Serial Expenditures, Total Salary Expenditures, and Operating Expenditures were revised due to unavailable data.
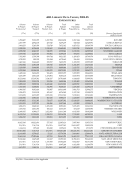
EXPENDITURE TRENDS
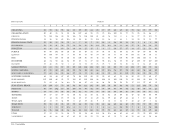
Library material budgets have risen sharply in order to sustain serial expenditures. Operating
expenditures, including many automation expenditures, have doubled since 1986, but during the last five
years have remained at relatively stable levels of investment—slightly more than $2 million for the
typical ARL library. The total salary expenditures median has increased only slightly over the past four
years, indicative of the difficulties libraries are having in recruitment and the mechanisms they are trying
to develop to compensate for the historically low salaries paid to their employees. Monograph
expenditures continue to increase, but at a much slower pace to accommodate the sharply increasing
serial expenditures. The annual consumer price index (CPI), included in Graph 4, provides a
comparative reference for the increases in library expenditures.
Table 4
Expenditure Trends in ARL Libraries, 1986‐2005
Median Values for Time‐Series Trends – Unadjusted dollar figures24
Year Library
Materials
Serial
Exp.
Monograph
Exp.
Total
Salary
Operating
Exp.
Total CPI
(Libraries) (105) (101) (98) (104) (104) (105)
1986 $2,705,297 $1,475,825 $1,118,931 $4,011,436 $1,111,914 $8,361,092 109.6
1987 $3,058,479 $1,769,353 $1,060,754 $4,361,646 $1,180,167 $8,990,001 113.6
1988 $3,369,896 $1,942,350 $1,109,845 $4,618,335 $1,198,674 $9,557,623 118.3
1989 $3,577,405 $2,097,789 $1,093,858 $5,236,292 $1,364,558 $10,183,315 124.0
1990 $3,903,358 $2,289,075 $1,329,950 $5,469,333 $1,386,618 $11,241,022 130.7
1991 $4,064,344 $2,519,065 $1,396,566 $5,885,814 $1,445,735 $11,990,794 136.2
1992 $4,156,510 $2,610,837 $1,348,786 $6,050,222 $1,390,245 $12,249,150 140.3
1993 $4,316,674 $2,917,381 $1,284,116 $5,962,470 $1,561,122 $12,265,696 144.5
1994 $4,572,276 $2,892,898 $1,282,569 $6,047,803 $1,676,701 $12,767,348 148.2
1995 $4,715,203 $3,128,181 $1,365,046 $6,312,770 $1,853,586 $13,171,893 152.4
1996 $5,126,482 $3,384,928 $1,437,028 $6,664,021 $1,997,233 $13,870,378 156.9
1997 $5,562,742 $3,610,714 $1,457,789 $6,893,582 $2,039,957 $14,526,674 160.5
1998 $5,795,223 $3,814,162 $1,486,436 $7,163,979 $2,072,903 $15,329,371 163.0
1999 $6,232,365 $4,093,793 $1,496,687 $7,476,532 $2,069,887 $16,737,261 166.6
2000 $6,744,281 $4,430,030 $1,645,248 $7,811,403 $1,991,852 $17,221,441 172.2
2001 $7,322,507 $4,610,327 $1,848,622 $8,106,666 $2,280,493 $17,620,048 177.5
2002 $7,599,249 $4,915,339 $1,806,964 $8,488,255 $2,136,616 $18,456,038 180.1
2003 $8,273,171 $5,372,822 $1,858,280 $8,813,191 $2,073,913 $19,030,188 183.9
2004 $8,286,431 $5,552,216 $1,824,296 $9,015,741 $2,274,878 $19,953,776 189.4
2005 $8,801,962 $5,933,378 $1,776,416 $9,268,364 $2,243,592 $20,663,012 195.4
Avg annual
%change
6.4% 7.6% 2.5% 4.5% 3.8% 4.9% 3.1%
24 Time series for Serial Expenditures, Total Salary Expenditures, and Operating Expenditures were revised due to unavailable data.