18
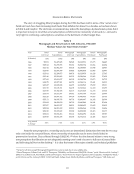
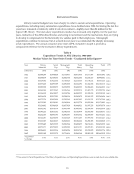
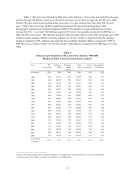
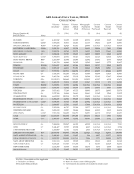
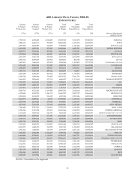
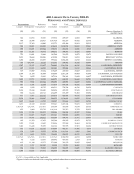
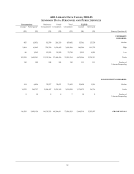
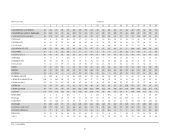
Table 5, “Resources per Student in ARL University Libraries,” shows that per‐student borrowing
activity through interlibrary loan has continued to increase at an annual average rate of 5.8% since 1986.
Further, libraries are borrowing three times more items on a per‐student basis than they did 19 years
ago.25 Table 5 also shows per‐student acquisition levels for both serials and monographs while
monographs purchased per student dropped in 2004‐05, the number of serials purchased per student
increased by 12%. As a result, ARL libraries acquired 37% fewer monographs per student in 2005 than in
1986, but 30% more serials. ARL libraries acquired 1,100 serial subscriptions and 1,360 monographs per 1,000
students and the median number of volumes added was 3.27 per student, compared to the 4.14 volumes
added per student in 1986. Libraries also reported fewer staff per student in 2005 as compared to 1986: in
2005, there was a median number of 11.9 total staff per 1,000 students, compared to the 1986 figure of 16 per
1,000.
Table 5
Resources per Student in ARL University Libraries, 1986‐2005
Median of Ratio Values for Time‐Series Trends26
Year ILL:
Borrowed
Volumes
Held
Volumes
Added
(Gross)
Total
Staff
Serials
Purchased
Monographs
Purchased
(Libraries) (103) (104) (104) (104) (36) (59)
1986 0.42 123.27 4.14 0.0159 0.85 2.15
1987 0.43 125.78 3.96 0.0165 0.84 1.86
1988 0.44 128.65 3.82 0.0161 0.85 1.65
1989 0.50 130.32 3.79 0.0163 0.86 1.75
1990 0.55 133.78 3.85 0.0156 0.86 1.83
1991 0.62 137.41 3.93 0.0154 0.85 1.79
1992 0.62 137.68 3.94 0.0153 0.84 1.54
1993 0.67 146.08 3.74 0.0152 0.80 1.46
1994 0.74 151.43 4.06 0.0153 0.79 1.54
1995 0.80 154.27 4.40 0.0147 0.83 1.56
1996 0.87 158.62 3.74 0.0146 0.80 1.44
1997 0.88 159.87 4.01 0.0142 0.77 1.52
1998 0.96 159.52 4.06 0.0145 0.73 1.42
1999 1.04 160.34 4.00 0.0142 0.77 1.42
2000 1.13 158.32 3.79 0.0141 0.77 1.63
2001 1.17 157.55 3.79 0.0136 0.79 1.65
2002 1.15 156.93 3.85 0.0131 0.82 1.54
2003 1.14 156.95 3.49 0.0126 0.85 1.46
2004 1.20 154.75 3.42 0.0121 0.98 1.53
2005 1.23 158.79 3.27 0.0119 1.10 1.36
Avg annual
%change
5.8% 1.3% -1.2% -1.5% 1.4% -2.4%
25 This overall trend should not be interpreted rigidly, as it negates the varying experiences of individual libraries.
26 All time‐series in this table have been revised due to unavailable data.
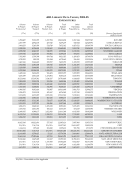
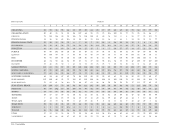