59
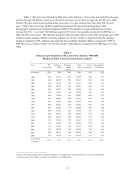
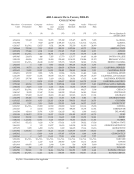
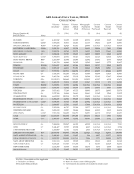
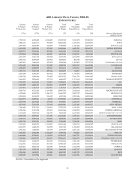
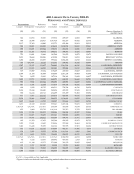
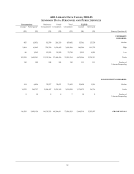
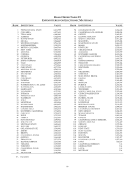
ARL LIBRARY DATA TABLES, 2004-05
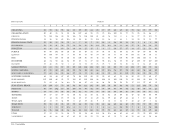
SUMMARY DATA: PERSONNEL AND PUBLIC SERVICES
Presentations Reference Initial Total ILL/DD
Groups* Participants* Transactions* Circulation Circulation Loaned Borrowed
(29) (30) (31) (32) (33) (34) (35) (Survey Question #)
UNIVERSITY
LIBRARIES:
805 13,851 82,590 281,333 459,492 35,541 25,729 Median
2,904 61,042 578,220 1,620,495 3,856,268 180,504 101,722 High
96 1,242 12,553 51,592 75,719 2,513 4,921 Low
102,359 1,650,381 11,155,266 37,488,426 70,281,764 4,470,546 3,278,311 Totals
110 109 108 104 110 111 111 Number of
Libraries Responding
NONUNIVERSITY LIBRARIES:
434 6,056 79,577 78,671 71,632 23,658 1,514 Median
14,223 369,757 3,004,497 3,076,185 3,024,599 1,178,973 56,716 Totals
9 10 9 8 7 10 9 Number of
Libraries Responding
116,582 2,020,138 14,159,763 40,564,611 73,306,363 5,649,519 3,335,027 GRAND TOTALS
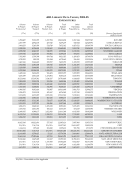
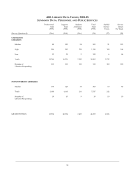
ARL LIBRARY DATA TABLES, 2004-05
SUMMARY DATA: PERSONNEL AND PUBLIC SERVICES
Presentations Reference Initial Total ILL/DD
Groups* Participants* Transactions* Circulation Circulation Loaned Borrowed
(29) (30) (31) (32) (33) (34) (35) (Survey Question #)
UNIVERSITY
LIBRARIES:
805 13,851 82,590 281,333 459,492 35,541 25,729 Median
2,904 61,042 578,220 1,620,495 3,856,268 180,504 101,722 High
96 1,242 12,553 51,592 75,719 2,513 4,921 Low
102,359 1,650,381 11,155,266 37,488,426 70,281,764 4,470,546 3,278,311 Totals
110 109 108 104 110 111 111 Number of
Libraries Responding
NONUNIVERSITY LIBRARIES:
434 6,056 79,577 78,671 71,632 23,658 1,514 Median
14,223 369,757 3,004,497 3,076,185 3,024,599 1,178,973 56,716 Totals
9 10 9 8 7 10 9 Number of
Libraries Responding
116,582 2,020,138 14,159,763 40,564,611 73,306,363 5,649,519 3,335,027 GRAND TOTALS