6
EVOLUTION OF DEFINITIONS: A MOVING TARGET
Definitions of the categories used in the ARL Statistics are based on the Library Statistics,
ANSI/NISO Z39.7‐1995 (Bethesda, MD: NISO Press, 1997),4 which was revised into the NISO Z39.7‐2002.5
ARL revised the definitions in 2003‐04, incorporating the clarifications formerly provided through the ARL
Statistics Q&A.6 The interpretations are established through discussions within the ARL Statistics and
Assessment Committee7 and with the ARL Survey Coordinators8 who have the responsibility for filling in the
surveys. For example, see a discussion document regarding counting electronic serials.9
This year the existing definitions of the ARL Statistics data items were modified to include
electronic resources, electronic journals, and e‐books in the existing categories. For example, in 1999‐2000
e‐books were reported together with volumes held for the first time, as long as the library owned those e‐
books and they conformed to a print‐equivalent model (see ARL Statistics Q&A for further clarification).
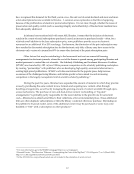
In general terms, there is a sense that the ARL Statistics, which primarily focus on input and output
measures, have served libraries adequately but in a limited way by describing the range of resources and
service activities in a quantifiable manner. After a decade of testing and data collection in the ARL
Supplementary Statistics survey, some new data elements migrated to the ARL Statistics in 2003‐04. A new
supplementary statistics survey has been developed and the data elements there focus primarily on
electronic resources (e‐metrics), which tend to be in flux. Development efforts tend to focus on the ARL
New Measures Initiative projects10 which emphasize service quality, impact and outcome indicators
(where there is general consensus that libraries lack agreed‐upon frameworks), and tools they can use to
measure these aspects of their operations successfully.
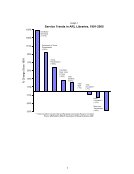
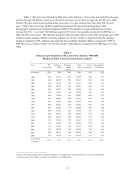
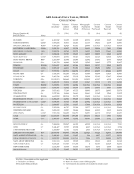
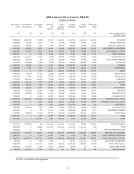
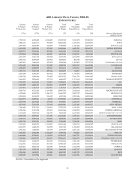
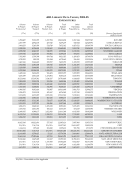
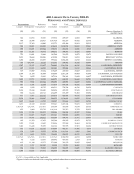
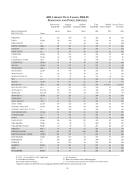
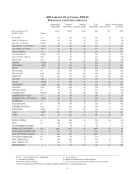
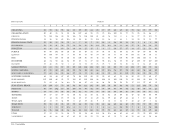
SERVICE ACTIVITY TRENDS
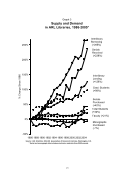
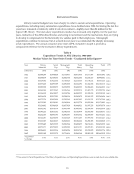
The success of an academic library is dependent not only on the information resources it owns or
licenses, but also on the services it provides. ARL collects data about public service activities such as
circulation (initial and total), reference transactions, library instruction (group presentations and participants
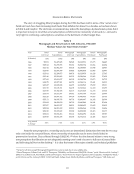
in these presentations), and interlibrary borrowing and lending (see Table 1). These data, rather than being
comprehensive for the range of user‐initiated library activities, represent select service areas.
Readers should take care when using service indicators for comparing institutions, because local
policies can influence the level of service activities. Loan periods, for example, are usually determined by
local policies thus, a library with a shorter loan period will report a larger number of circulation transactions
than will a library with a longer loan period, other things being equal. Despite the standardization efforts at
the definitional level, there is wide variation at the local level in terms of the processes used.
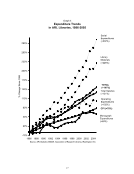
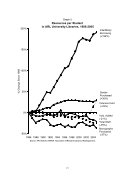
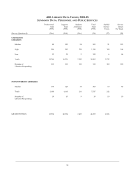
With this in mind, it is useful to look at the trends of these select services assuming that changes due
to policies and other conditions affecting measurement of services are random across institutions. For
example, the median value of the ratio of total to initial circulation has been gradually increasing over the last
few years, indicating that users are more likely to renew library materials, or possibly that they want the
4 See also http://www.techstreet.com/cgi‐bin/pdf/free/152592/z39‐7.pdf .
5 NISO Z39.7 – 2002 Draft Standard for Trial Use: http://www.niso.org/emetrics/.
6 ARL Statistics Q&A: http://www.arl.org/stats/arlstat/arlstatqa.html.
7 ARL Statistics and Measurement Committee homepage: http://www.arl.org/stats/program/meeting.html.
8 ARL Survey Coordinators homepage: http://www.arl.org/stats/coordinator.html.
9 Julia Blixrud, “Counting Electronic Serials: A Discussion Document,” http://www.arl.org/stats/counting.html.
10 ARL New Measures Initiative: http://www.arl.org/stats/newmeas/newmeas.html.
EVOLUTION OF DEFINITIONS: A MOVING TARGET
Definitions of the categories used in the ARL Statistics are based on the Library Statistics,
ANSI/NISO Z39.7‐1995 (Bethesda, MD: NISO Press, 1997),4 which was revised into the NISO Z39.7‐2002.5
ARL revised the definitions in 2003‐04, incorporating the clarifications formerly provided through the ARL
Statistics Q&A.6 The interpretations are established through discussions within the ARL Statistics and
Assessment Committee7 and with the ARL Survey Coordinators8 who have the responsibility for filling in the
surveys. For example, see a discussion document regarding counting electronic serials.9
This year the existing definitions of the ARL Statistics data items were modified to include
electronic resources, electronic journals, and e‐books in the existing categories. For example, in 1999‐2000
e‐books were reported together with volumes held for the first time, as long as the library owned those e‐
books and they conformed to a print‐equivalent model (see ARL Statistics Q&A for further clarification).
In general terms, there is a sense that the ARL Statistics, which primarily focus on input and output
measures, have served libraries adequately but in a limited way by describing the range of resources and
service activities in a quantifiable manner. After a decade of testing and data collection in the ARL
Supplementary Statistics survey, some new data elements migrated to the ARL Statistics in 2003‐04. A new
supplementary statistics survey has been developed and the data elements there focus primarily on
electronic resources (e‐metrics), which tend to be in flux. Development efforts tend to focus on the ARL
New Measures Initiative projects10 which emphasize service quality, impact and outcome indicators
(where there is general consensus that libraries lack agreed‐upon frameworks), and tools they can use to
measure these aspects of their operations successfully.
SERVICE ACTIVITY TRENDS
The success of an academic library is dependent not only on the information resources it owns or
licenses, but also on the services it provides. ARL collects data about public service activities such as
circulation (initial and total), reference transactions, library instruction (group presentations and participants
in these presentations), and interlibrary borrowing and lending (see Table 1). These data, rather than being
comprehensive for the range of user‐initiated library activities, represent select service areas.
Readers should take care when using service indicators for comparing institutions, because local
policies can influence the level of service activities. Loan periods, for example, are usually determined by
local policies thus, a library with a shorter loan period will report a larger number of circulation transactions
than will a library with a longer loan period, other things being equal. Despite the standardization efforts at
the definitional level, there is wide variation at the local level in terms of the processes used.
With this in mind, it is useful to look at the trends of these select services assuming that changes due
to policies and other conditions affecting measurement of services are random across institutions. For
example, the median value of the ratio of total to initial circulation has been gradually increasing over the last
few years, indicating that users are more likely to renew library materials, or possibly that they want the
4 See also http://www.techstreet.com/cgi‐bin/pdf/free/152592/z39‐7.pdf .
5 NISO Z39.7 – 2002 Draft Standard for Trial Use: http://www.niso.org/emetrics/.
6 ARL Statistics Q&A: http://www.arl.org/stats/arlstat/arlstatqa.html.
7 ARL Statistics and Measurement Committee homepage: http://www.arl.org/stats/program/meeting.html.
8 ARL Survey Coordinators homepage: http://www.arl.org/stats/coordinator.html.
9 Julia Blixrud, “Counting Electronic Serials: A Discussion Document,” http://www.arl.org/stats/counting.html.
10 ARL New Measures Initiative: http://www.arl.org/stats/newmeas/newmeas.html.