SUMA:
Rethinking
Space
&
Service
Design
through
Observa
onal
Data
Tobi
Hines,
User
Services
&
Mul
media
Librarian
and
Sara
Wright,
Head
of
User
Services
Albert
R.
Mann
Library,
Cornell
University,
Ithaca,
NY
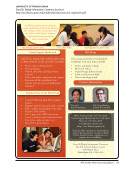
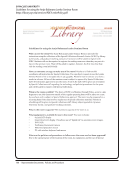
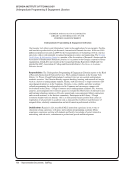
What
is
SUMA?
SUMA
is
an
open-‐source
tablet
and
web-‐based
assessment
toolkit
for
collec
ng
and
analyzing
observa
onal
data
about
the
usage
of
physical
spaces
and
services,
developed
at
North
Carolina
State
University
Libraries.
The
tool
streamlines
exis
ng
data
collec
on,
enables
fast,
hassle-‐free
mobile
data
collec
on,
provides
sophis
cated
data
analysis
and
visualiza
on
capabili
es
for
non-‐technical
users,
and
promotes
observa
onal
data
analysis
as
an
integral
part
of
service
and
space
design
and
day-‐to-‐day
planning.
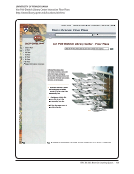
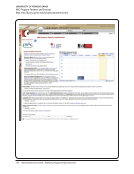
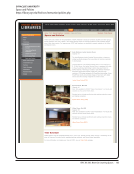
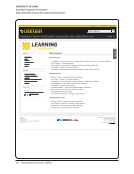
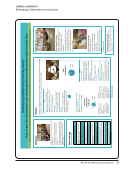
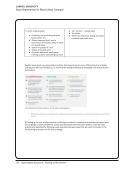
Data
Analysis
Capabili4es
SUMA's
data
analysis
tools
allow
users
to
explore
their
data
through
a
web-‐based
interface.
Users
can
easily
change
sePngs
to
view
data
from
different
collec
ng
programs,
loca
ons,
ac
vi
es,
and
me
periods.
SUMA
currently
provides
an
interac
ve
me-‐series,
the
ability
to
splice
data
by
me
of
day,
views
of
propor
onal
ac
vi
es
and
loca
on
counts,
and
a
calendar
heat
map.
Data
Exports
•
Charts
and
graphs
•
Raw
comma-‐separated
data
for
use
in
spreadsheet
applica
ons
•
Summary
data
such
as
counts
and
percentages
by
day/month/year
for
loca
ons
and
ac
vi
es
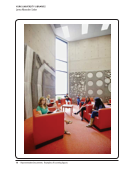
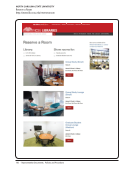
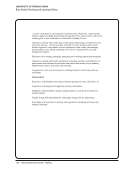
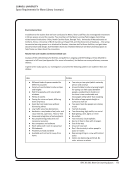
Improving
Spaces
&
Services
SUMA
adds
value
to
gate
count
data
and
more
tradi
onal
assessment
methods,
i.e.
surveys,
focus
groups,
ethnographic
studies,
by:
•
Tracking
observa
onal
data
on
how
populated
specific
spaces
are
•
Tallies
through
customizable
categories,
what
patrons
are
doing
in
specific
spaces
•
Collec
on
over
me
will
allow
viewing
of
how
space
and
service
needs
shiT
over
the
course
of
an
academic
year
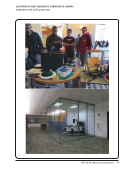
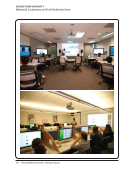
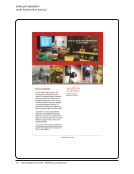
Usage
and
Implica4ons
for
Mann
Library
Members
of
the
Mann
Learning
Technologies
CommiUee
and
student
employees
are
working
together
to
do:
•
Head
Counts
6Xs
a
day
•
Room
Usage
Counts
5Xs
a
day
•
Space
Usage
Counts
3Xs
a
day
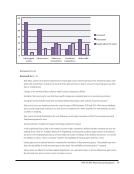
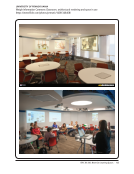
As
we
con
nue
to
collect
data,
we
will
have
a
beUer
understanding
of
how
students
use
the
library,
what
type
of
studying
they
do,
and
which
loca
ons
they
prefer.
In
our
aUempts
to
refresh
spaces
through
new
furniture
purchases
or
rearrangement
of
exis
ng
pieces,
we
can
ensure
that
we
are
crea
ng
spaces
that
students
want
to
use.
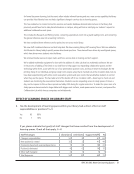
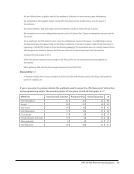
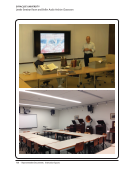
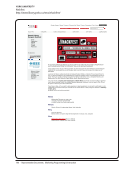
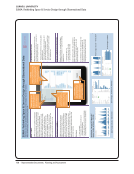
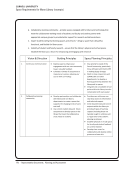
Data
Results
–
January
22nd-‐March
22nd
Approx.
Number
of
Visitors:
114,
965
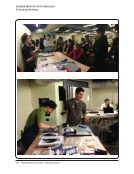
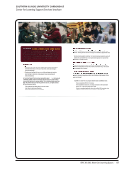
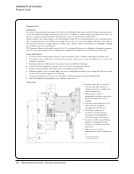
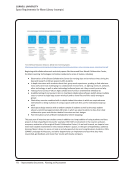
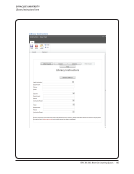
Collec4ng
Program
Design
mul
ple
collec
on
ini
a
ves
and
define
the
different
spaces
and
ac
vi
es
for
each
one.
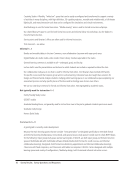
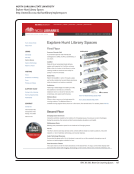
Ac4vi4es
Include
as
many
ac
vi
es
as
you
like.
Define
and
group
your
tags
for
analysis,
specifying
which
are
required
and
which
can
have
mul
ple
states.
Loca4ons
Define
the
loca
ons.
Share
your
mul
-‐
ered
loca
on
“trees”
across
ini
a
ves
or
create
new
ones
as
necessary.
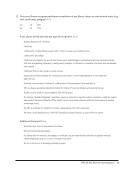
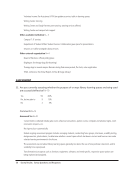
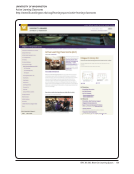
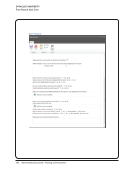
Count
BuUon
User
tes
ng
showed
the
need
for
a
large
“Count”
buUon
that
staff
could
use
without
looking
or
using
their
thumb.
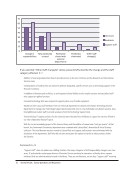
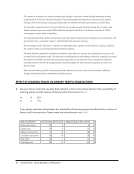
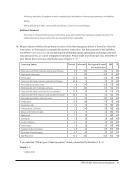
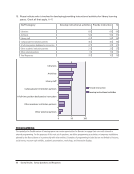
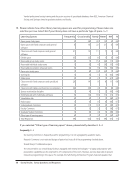
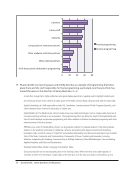
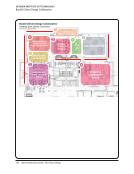
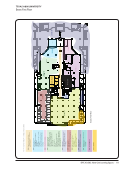
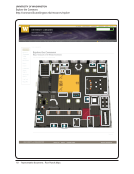
Space
Usage,
January
–
March
2014
Space
Usage,
Loca
ons
and
Ac
vi
es
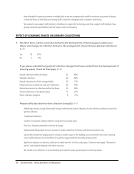
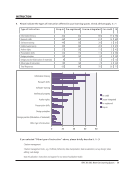
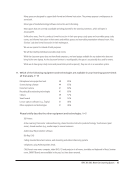
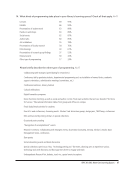
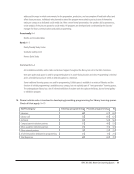
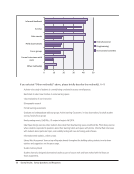
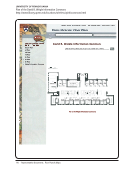
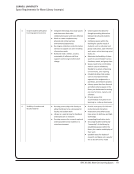
Room
Usage,
January
–
March
2014
Room
Usage,
Loca
ons
168 · Representative Documents: Planning and Assessment
CORNELL UNIVERSITY
SUMA: Rethinking Space &Service Design through Observational Data
Rethinking
Space
&
Service
Design
through
Observa
onal
Data
Tobi
Hines,
User
Services
&
Mul
media
Librarian
and
Sara
Wright,
Head
of
User
Services
Albert
R.
Mann
Library,
Cornell
University,
Ithaca,
NY
What
is
SUMA?
SUMA
is
an
open-‐source
tablet
and
web-‐based
assessment
toolkit
for
collec
ng
and
analyzing
observa
onal
data
about
the
usage
of
physical
spaces
and
services,
developed
at
North
Carolina
State
University
Libraries.
The
tool
streamlines
exis
ng
data
collec
on,
enables
fast,
hassle-‐free
mobile
data
collec
on,
provides
sophis
cated
data
analysis
and
visualiza
on
capabili
es
for
non-‐technical
users,
and
promotes
observa
onal
data
analysis
as
an
integral
part
of
service
and
space
design
and
day-‐to-‐day
planning.
Data
Analysis
Capabili4es
SUMA's
data
analysis
tools
allow
users
to
explore
their
data
through
a
web-‐based
interface.
Users
can
easily
change
sePngs
to
view
data
from
different
collec
ng
programs,
loca
ons,
ac
vi
es,
and
me
periods.
SUMA
currently
provides
an
interac
ve
me-‐series,
the
ability
to
splice
data
by
me
of
day,
views
of
propor
onal
ac
vi
es
and
loca
on
counts,
and
a
calendar
heat
map.
Data
Exports
•
Charts
and
graphs
•
Raw
comma-‐separated
data
for
use
in
spreadsheet
applica
ons
•
Summary
data
such
as
counts
and
percentages
by
day/month/year
for
loca
ons
and
ac
vi
es
Improving
Spaces
&
Services
SUMA
adds
value
to
gate
count
data
and
more
tradi
onal
assessment
methods,
i.e.
surveys,
focus
groups,
ethnographic
studies,
by:
•
Tracking
observa
onal
data
on
how
populated
specific
spaces
are
•
Tallies
through
customizable
categories,
what
patrons
are
doing
in
specific
spaces
•
Collec
on
over
me
will
allow
viewing
of
how
space
and
service
needs
shiT
over
the
course
of
an
academic
year
Usage
and
Implica4ons
for
Mann
Library
Members
of
the
Mann
Learning
Technologies
CommiUee
and
student
employees
are
working
together
to
do:
•
Head
Counts
6Xs
a
day
•
Room
Usage
Counts
5Xs
a
day
•
Space
Usage
Counts
3Xs
a
day
As
we
con
nue
to
collect
data,
we
will
have
a
beUer
understanding
of
how
students
use
the
library,
what
type
of
studying
they
do,
and
which
loca
ons
they
prefer.
In
our
aUempts
to
refresh
spaces
through
new
furniture
purchases
or
rearrangement
of
exis
ng
pieces,
we
can
ensure
that
we
are
crea
ng
spaces
that
students
want
to
use.
Data
Results
–
January
22nd-‐March
22nd
Approx.
Number
of
Visitors:
114,
965
Collec4ng
Program
Design
mul
ple
collec
on
ini
a
ves
and
define
the
different
spaces
and
ac
vi
es
for
each
one.
Ac4vi4es
Include
as
many
ac
vi
es
as
you
like.
Define
and
group
your
tags
for
analysis,
specifying
which
are
required
and
which
can
have
mul
ple
states.
Loca4ons
Define
the
loca
ons.
Share
your
mul
-‐
ered
loca
on
“trees”
across
ini
a
ves
or
create
new
ones
as
necessary.
Count
BuUon
User
tes
ng
showed
the
need
for
a
large
“Count”
buUon
that
staff
could
use
without
looking
or
using
their
thumb.
Space
Usage,
January
–
March
2014
Space
Usage,
Loca
ons
and
Ac
vi
es
Room
Usage,
January
–
March
2014
Room
Usage,
Loca
ons
168 · Representative Documents: Planning and Assessment
CORNELL UNIVERSITY
SUMA: Rethinking Space &Service Design through Observational Data