18 · ARL Statistics 2008–2009
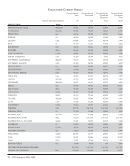
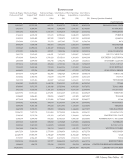
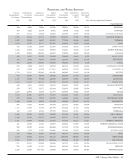
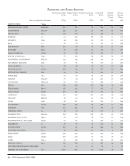
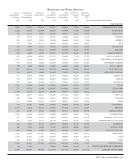
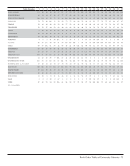
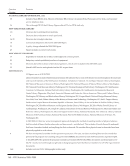
Table 6
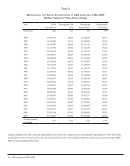
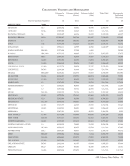
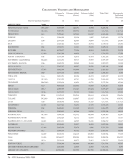
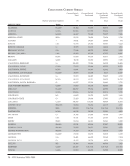
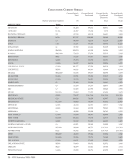
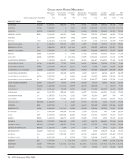
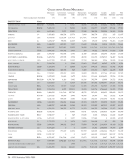
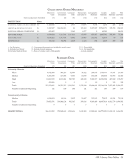
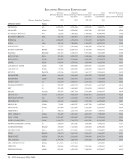
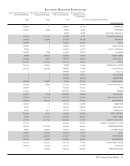
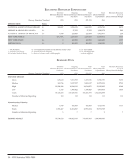
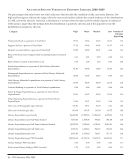
Electronic Resources Expenditures in ARL University Libraries, 2008–2009
Sum Number Reporting
Expenditures for Computer Files (one-time/
monographic purchase)
69,148,203 110
Expenditures for Electronic Serials 637,458,376 112
Expenditures for Bibliographic Utilities, Networks, etc.
(Library)
24,325,261 103
Expenditures for Bibliographic Utilities, Networks, etc.
(External)
21,695,047 92
Expenditures for Hardware and Software 77,239,838 111
Expenditures for Document Delivery/Interlibrary Loan 16,327,690 111
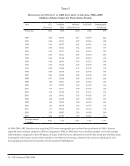
Table 6 contains data on several items that previously had been collected only in the ARL Supplementary Statistics. These
data are especially useful because they reflect monies spent on all electronic serials, while the ARL Statistics categories
of “serials purchased” and “serials expenditures” include only those journals that provide full-text electronic versions
to their subscribers. The Expenditures for Electronic Serials time series may be viewed as an alternative to the Serials
Purchased series, both figures reflecting in their own way the influence the electronic serial is gaining in the modern
research library.
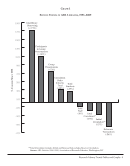
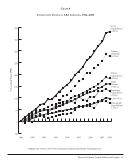
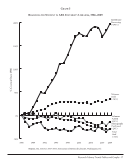
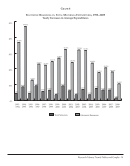
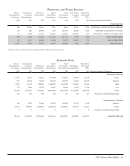
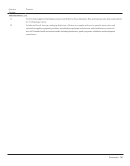
Not only have electronic materials expenditures grown sharply in the past decade, they have grown at a rate far
exceeding that of library materials expenditures overall. As shown in Graph 6, in every year of the last decade electronic
materials expenditures have grown sharply, anywhere between two and ten times faster than materials expenditures
have.
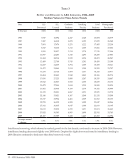
The average ARL university library now spends 56% of its materials budget on electronic materials (Tables 7A and 7B),
and 82 ARL libraries report that they spent more than 50% of their materials budget on electronic materials (see Rank
Order Table 21).
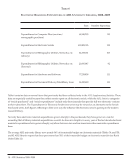
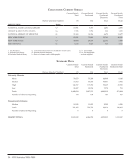
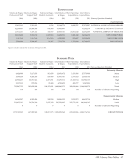
Table 6
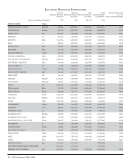
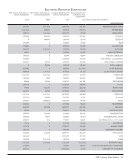
Electronic Resources Expenditures in ARL University Libraries, 2008–2009
Sum Number Reporting
Expenditures for Computer Files (one-time/
monographic purchase)
69,148,203 110
Expenditures for Electronic Serials 637,458,376 112
Expenditures for Bibliographic Utilities, Networks, etc.
(Library)
24,325,261 103
Expenditures for Bibliographic Utilities, Networks, etc.
(External)
21,695,047 92
Expenditures for Hardware and Software 77,239,838 111
Expenditures for Document Delivery/Interlibrary Loan 16,327,690 111
Table 6 contains data on several items that previously had been collected only in the ARL Supplementary Statistics. These
data are especially useful because they reflect monies spent on all electronic serials, while the ARL Statistics categories
of “serials purchased” and “serials expenditures” include only those journals that provide full-text electronic versions
to their subscribers. The Expenditures for Electronic Serials time series may be viewed as an alternative to the Serials
Purchased series, both figures reflecting in their own way the influence the electronic serial is gaining in the modern
research library.
Not only have electronic materials expenditures grown sharply in the past decade, they have grown at a rate far
exceeding that of library materials expenditures overall. As shown in Graph 6, in every year of the last decade electronic
materials expenditures have grown sharply, anywhere between two and ten times faster than materials expenditures
have.
The average ARL university library now spends 56% of its materials budget on electronic materials (Tables 7A and 7B),
and 82 ARL libraries report that they spent more than 50% of their materials budget on electronic materials (see Rank
Order Table 21).