14 · ARL Statistics 2008–2009
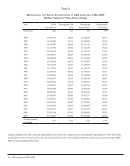
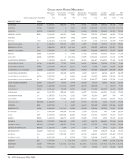
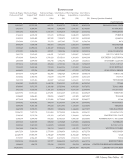
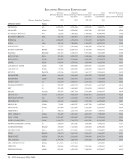
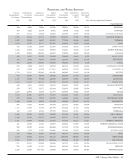
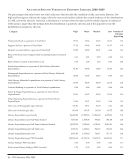
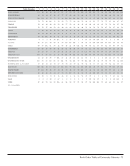
Table 4
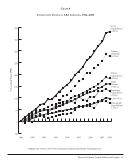
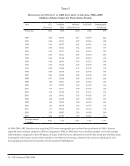
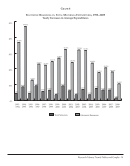
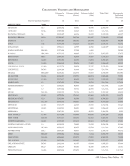
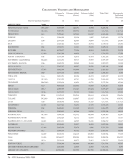
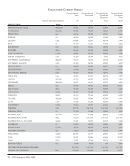
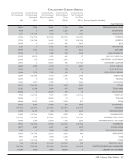
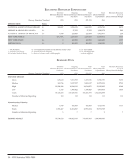
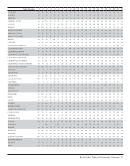
Expenditure Trends in ARL Libraries, 1986–2009
Median Values for Time-Series Trends—Unadjusted dollar figures
Year Library
Materials
Serial Exp. Monograph
Exp.
Total Salary Operating
Exp.
Total CPI
(Libraries) (105) (100) (97) (104) (104) (105)
1986 2,705,297 1,496,775 1,120,645 4,011,436 1,111,914 8,361,092 109.6
1987 3,058,479 1,769,960 1,064,484 4,361,646 1,180,167 8,990,001 113.6
1988 3,369,896 1,947,559 1,141,226 4,618,335 1,198,674 9,557,623 118.3
1989 3,577,405 2,113,976 1,106,073 5,236,292 1,364,558 10,183,315 124.0
1990 3,903,358 2,296,910 1,330,747 5,469,333 1,386,618 11,241,022 130.7
1991 4,064,344 2,548,687 1,400,738 5,885,814 1,445,735 11,990,794 136.2
1992 4,156,510 2,620,832 1,353,865 6,050,222 1,390,245 12,249,150 140.3
1993 4,316,674 2,918,569 1,295,807 5,962,470 1,561,122 12,265,696 144.5
1994 4,572,276 2,912,495 1,309,807 6,047,803 1,676,701 12,767,348 148.2
1995 4,715,203 3,131,033 1,365,575 6,312,770 1,853,586 13,171,893 152.4
1996 5,126,482 3,389,118 1,444,015 6,664,021 1,997,233 13,870,378 156.9
1997 5,562,742 3,642,541 1,460,234 6,893,582 2,039,957 14,526,674 160.5
1998 5,795,223 3,816,497 1,486,764 7,163,979 2,072,903 15,329,371 163.0
1999 6,232,365 4,095,934 1,506,651 7,476,532 2,069,887 16,737,261 166.6
2000 6,744,281 4,430,812 1,657,349 7,811,403 1,991,852 17,221,441 172.2
2001 7,322,507 4,660,349 1,864,023 8,106,666 2,280,493 17,620,048 177.5
2002 7,599,249 4,939,225 1,812,826 8,488,255 2,136,616 18,456,038 180.1
2003 8,273,171 5,392,007 1,873,157 8,813,191 2,073,913 19,030,188 183.9
2004 8,286,431 5,580,157 1,839,412 9,015,741 2,274,878 19,953,776 189.4
2005 8,801,962 5,962,446 1,784,841 9,268,364 2,243,592 20,663,012 195.4
2006 9,174,734 6,307,292 2,044,272 9,647,695 2,540,171 21,694,210 203.5
2007 9,600,793 6,587,241 2,097,078 9,940,406 2,549,139 22,810,227 208.3
2008 10,454,644 7,097,140 2,084,991 10,302,966 2,649,899 24,084,535* 219.9
2009 10,185,101 7,193,291 1,981,284 10,462,624 2,530,251 23,622,720 215.4
Average annual
%change
6.2% 7.4% 2.6% 4.5% 3.8% 4.8% 3.0%
*2007–2008 publication incorrectly reported 24,804,535.
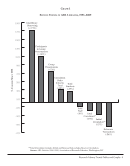
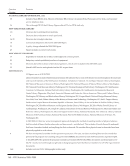
Operating expenditures, including many automation expenditures, have doubled since 1986, but have remained at
relatively stable levels of investment since 2008. The total salary expenditures median remained basically the same since
last year (the overall annual average rate since 1986 is 4.5%). Monograph expenditures continue to increase, but have in
2008–2009 increased at a lower rate than the consumer price index (CPI). Total Library Expenditures decreased in 2009 as
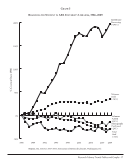
compared to 2008, even as serial expenditures continued to rise. The annual consumer price index, included in Graph 4,
provides a comparative reference for the increases in library expenditures.
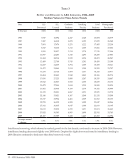
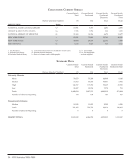
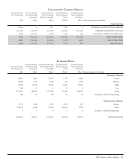
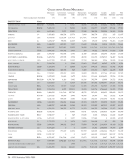
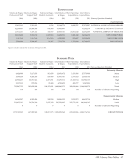
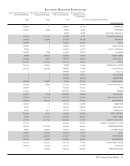
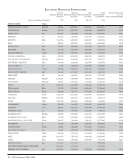
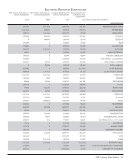
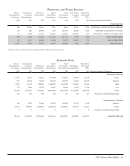
Table 4
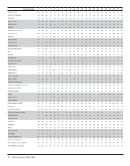
Expenditure Trends in ARL Libraries, 1986–2009
Median Values for Time-Series Trends—Unadjusted dollar figures
Year Library
Materials
Serial Exp. Monograph
Exp.
Total Salary Operating
Exp.
Total CPI
(Libraries) (105) (100) (97) (104) (104) (105)
1986 2,705,297 1,496,775 1,120,645 4,011,436 1,111,914 8,361,092 109.6
1987 3,058,479 1,769,960 1,064,484 4,361,646 1,180,167 8,990,001 113.6
1988 3,369,896 1,947,559 1,141,226 4,618,335 1,198,674 9,557,623 118.3
1989 3,577,405 2,113,976 1,106,073 5,236,292 1,364,558 10,183,315 124.0
1990 3,903,358 2,296,910 1,330,747 5,469,333 1,386,618 11,241,022 130.7
1991 4,064,344 2,548,687 1,400,738 5,885,814 1,445,735 11,990,794 136.2
1992 4,156,510 2,620,832 1,353,865 6,050,222 1,390,245 12,249,150 140.3
1993 4,316,674 2,918,569 1,295,807 5,962,470 1,561,122 12,265,696 144.5
1994 4,572,276 2,912,495 1,309,807 6,047,803 1,676,701 12,767,348 148.2
1995 4,715,203 3,131,033 1,365,575 6,312,770 1,853,586 13,171,893 152.4
1996 5,126,482 3,389,118 1,444,015 6,664,021 1,997,233 13,870,378 156.9
1997 5,562,742 3,642,541 1,460,234 6,893,582 2,039,957 14,526,674 160.5
1998 5,795,223 3,816,497 1,486,764 7,163,979 2,072,903 15,329,371 163.0
1999 6,232,365 4,095,934 1,506,651 7,476,532 2,069,887 16,737,261 166.6
2000 6,744,281 4,430,812 1,657,349 7,811,403 1,991,852 17,221,441 172.2
2001 7,322,507 4,660,349 1,864,023 8,106,666 2,280,493 17,620,048 177.5
2002 7,599,249 4,939,225 1,812,826 8,488,255 2,136,616 18,456,038 180.1
2003 8,273,171 5,392,007 1,873,157 8,813,191 2,073,913 19,030,188 183.9
2004 8,286,431 5,580,157 1,839,412 9,015,741 2,274,878 19,953,776 189.4
2005 8,801,962 5,962,446 1,784,841 9,268,364 2,243,592 20,663,012 195.4
2006 9,174,734 6,307,292 2,044,272 9,647,695 2,540,171 21,694,210 203.5
2007 9,600,793 6,587,241 2,097,078 9,940,406 2,549,139 22,810,227 208.3
2008 10,454,644 7,097,140 2,084,991 10,302,966 2,649,899 24,084,535* 219.9
2009 10,185,101 7,193,291 1,981,284 10,462,624 2,530,251 23,622,720 215.4
Average annual
%change
6.2% 7.4% 2.6% 4.5% 3.8% 4.8% 3.0%
*2007–2008 publication incorrectly reported 24,804,535.
Operating expenditures, including many automation expenditures, have doubled since 1986, but have remained at
relatively stable levels of investment since 2008. The total salary expenditures median remained basically the same since
last year (the overall annual average rate since 1986 is 4.5%). Monograph expenditures continue to increase, but have in
2008–2009 increased at a lower rate than the consumer price index (CPI). Total Library Expenditures decreased in 2009 as
compared to 2008, even as serial expenditures continued to rise. The annual consumer price index, included in Graph 4,
provides a comparative reference for the increases in library expenditures.