12 · ARL Statistics 2008–2009
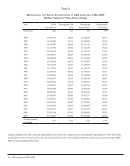
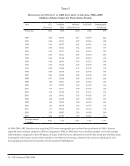
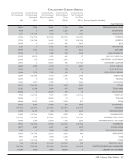
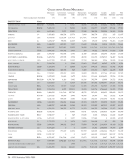
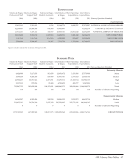
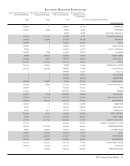
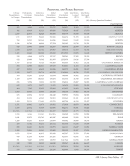
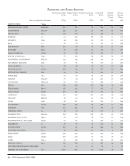
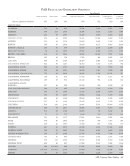
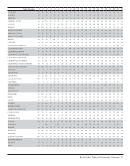
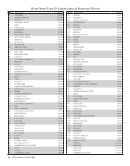
Table 3
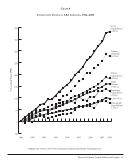
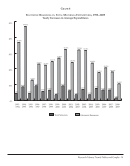
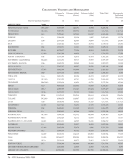
Supply and Demand in ARL Libraries, 1986–2009
Median Values for Time-Series Trends
Year ILL:
Borrowed
ILL:
Loaned
Graduate
Students
Teaching
Faculty
Total
Students
Monographs
Purchased
(Libraries) (103) (103) (104) (101) (103) (58)
1986 7,047 16,092 2,327 1,124 16,684 32,679
1987 7,387 16,318 3,078 1,195 17,029 26,240
1988 7,881 17,476 3,251 1,222 17,485 25,238
1989 8,547 19,638 3,312 1,285 17,866 27,082
1990 9,595 20,837 3,314 1,278 17,745 27,546
1991 10,397 23,285 3,310 1,295 18,290 27,843
1992 11,362 22,514 3,539 1,356 18,273 26,947
1993 12,489 22,740 3,745 1,281 18,450 25,188
1994 14,007 24,039 3,794 1,289 18,305 25,341
1995 14,472 24,864 3,914 1,308 18,209 25,707
1996 15,278 25,720 3,904 1,251 18,320 25,911
1997 16,264 25,463 3,942 1,263 18,166 28,576
1998 17,656 27,223 3,880 1,247 18,335 24,447
1999 18,942 26,837 3,933 1,255 18,609 25,173
2000 20,475 27,044 3,844 1,239 18,908 28,024
2001 21,902 28,950 4,159 1,279 19,102 30,494
2002 21,339 29,021 4,067 1,251 19,925 31,578
2003 22,146 33,421 4,167 1,268 21,132 33,208
2004 25,737 33,934 4,461 1,369 21,562 30,155
2005 25,729 36,325 4,595 1,355 22,047 30,546
2006 27,412 36,035 4,647 1,388 22,618 33,145
2007 26,813 35,838 4,709 1,451 22,874 36,462
2008 27,822 36,383 4,905 1,490 22,762 32,745
2009 28,187 35,589 5,108 1,425 23,303 34,594
Average annual
%change
6.5% 3.7% 3.6% 1.1% 1.5% 0.3%
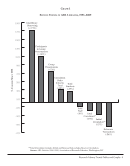
Interlibrary borrowing, which showed a marked growth in the last decade, continued to increase in 2008–2009. However,
interlibrary lending decreased slightly over 2008 levels. Despite this slight downward trend in interlibrary lending in
2009, libraries continued to lend more than they borrowed overall.
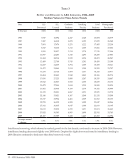
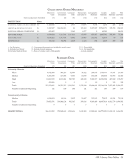
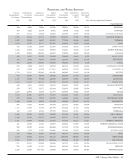
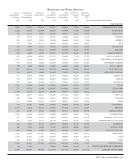
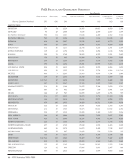
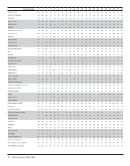
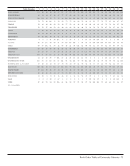
Table 3
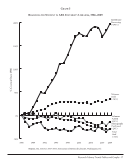
Supply and Demand in ARL Libraries, 1986–2009
Median Values for Time-Series Trends
Year ILL:
Borrowed
ILL:
Loaned
Graduate
Students
Teaching
Faculty
Total
Students
Monographs
Purchased
(Libraries) (103) (103) (104) (101) (103) (58)
1986 7,047 16,092 2,327 1,124 16,684 32,679
1987 7,387 16,318 3,078 1,195 17,029 26,240
1988 7,881 17,476 3,251 1,222 17,485 25,238
1989 8,547 19,638 3,312 1,285 17,866 27,082
1990 9,595 20,837 3,314 1,278 17,745 27,546
1991 10,397 23,285 3,310 1,295 18,290 27,843
1992 11,362 22,514 3,539 1,356 18,273 26,947
1993 12,489 22,740 3,745 1,281 18,450 25,188
1994 14,007 24,039 3,794 1,289 18,305 25,341
1995 14,472 24,864 3,914 1,308 18,209 25,707
1996 15,278 25,720 3,904 1,251 18,320 25,911
1997 16,264 25,463 3,942 1,263 18,166 28,576
1998 17,656 27,223 3,880 1,247 18,335 24,447
1999 18,942 26,837 3,933 1,255 18,609 25,173
2000 20,475 27,044 3,844 1,239 18,908 28,024
2001 21,902 28,950 4,159 1,279 19,102 30,494
2002 21,339 29,021 4,067 1,251 19,925 31,578
2003 22,146 33,421 4,167 1,268 21,132 33,208
2004 25,737 33,934 4,461 1,369 21,562 30,155
2005 25,729 36,325 4,595 1,355 22,047 30,546
2006 27,412 36,035 4,647 1,388 22,618 33,145
2007 26,813 35,838 4,709 1,451 22,874 36,462
2008 27,822 36,383 4,905 1,490 22,762 32,745
2009 28,187 35,589 5,108 1,425 23,303 34,594
Average annual
%change
6.5% 3.7% 3.6% 1.1% 1.5% 0.3%
Interlibrary borrowing, which showed a marked growth in the last decade, continued to increase in 2008–2009. However,
interlibrary lending decreased slightly over 2008 levels. Despite this slight downward trend in interlibrary lending in
2009, libraries continued to lend more than they borrowed overall.