ARL Library Data Tables · 63
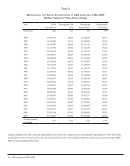
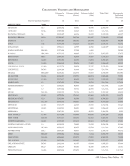
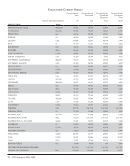
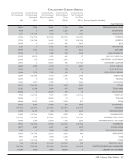
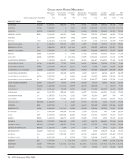
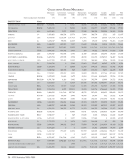
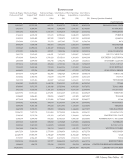
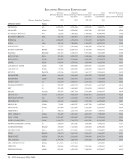
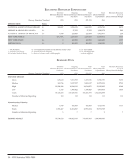
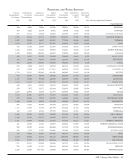
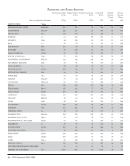
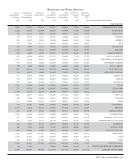
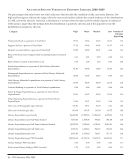
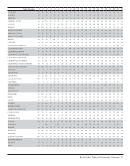
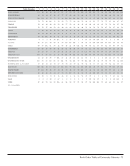
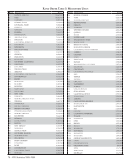
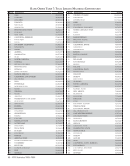
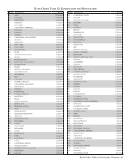
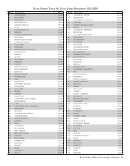
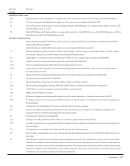
Personnel and Public Services
Library
Presentations
to Groups
Participants
in Group
Presentations
Reference
Transactions
Initial
Circulation
Transactions
Total
Circulation
Transactions
Total Items
Loaned
(ILL)
Total Items
Borrowed
(ILL)
(30) (31) (32) (33) (34) (35) (36) (Survey Question Number)
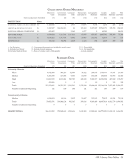
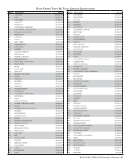
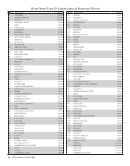
INSTITUTION
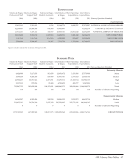
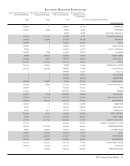
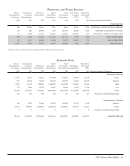
188 32,505 13,361 3,157 4,396 11,767 3,320 NATIONAL AGRICULTURAL LIBRARY
26 200 23,530 1,333 251,187 32,828 1,383 LIBRARY &ARCHIVES CANADA
70 1,089 90,340 146,207 146,207 228,439 247 NATIONAL LIBRARY OF MEDICINE
758 9,988 414,043 UA/NA UA/NA 9,155 3,000 NEW YORK PUBLIC
61 1,657 42,426 31,548 36,371 50,632 752 NEW YORK STATE
1,057 4,073 57,385 40,913 232,182 5,346 6,079 SMITHSONIAN
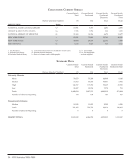
Figures in italics are derived from a sampling method rather than an actual count.
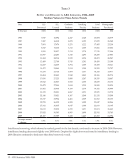
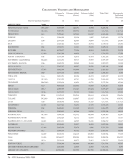
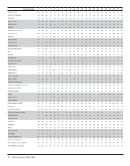
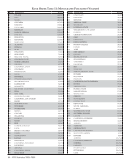
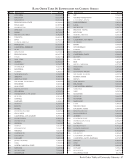
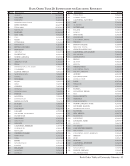
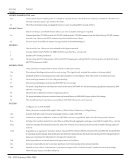
Summary Data
Library
Presentations
to Groups
Participants
in Group
Presentations
Reference
Transactions
Initial
Circulation
Transactions
Total
Circulation
Transactions
Total Items
Loaned (ILL)
Total Items
Borrowed
(ILL)
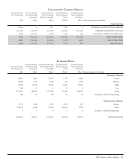
(30) (31) (32) (33) (34) (35) (36) (Survey Question Number)
University Libraries
1,003 17,619 72,622 315,348 575,892 39,855 32,109 Mean
877 15,384 61,258 244,382 423,657 35,424 28,258 Median
3,007 56,172 328,421 1,442,098 2,513,529 178,255 97,626 High
174 2,980 12,310 43,661 56,984 6,843 4,764 Low
112,344 1,973,311 7,915,841 34,688,244 65,075,780 4,543,485 3,660,400 Totals
112 112 109 110 113 114 114 Number of Libraries Reporting
Nonuniversity Libraries
188 4,073 73,863 59,987 146,207 31,325 2,192 Median
17,772 419,479 2,355,055 4,838,320 4,152,941 423,574 32,316 Totals
9 9 8 8 7 9 8 Number of Libraries Reporting
130,116 2,392,790 10,270,896 39,526,564 69,228,721 4,967,059 3,692,716 GRAND TOTALS
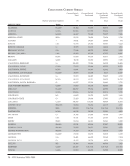
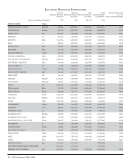
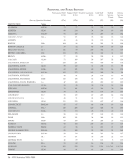
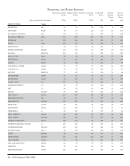
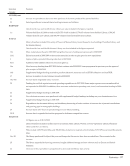
Personnel and Public Services
Library
Presentations
to Groups
Participants
in Group
Presentations
Reference
Transactions
Initial
Circulation
Transactions
Total
Circulation
Transactions
Total Items
Loaned
(ILL)
Total Items
Borrowed
(ILL)
(30) (31) (32) (33) (34) (35) (36) (Survey Question Number)
INSTITUTION
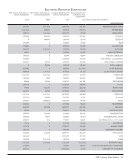
188 32,505 13,361 3,157 4,396 11,767 3,320 NATIONAL AGRICULTURAL LIBRARY
26 200 23,530 1,333 251,187 32,828 1,383 LIBRARY &ARCHIVES CANADA
70 1,089 90,340 146,207 146,207 228,439 247 NATIONAL LIBRARY OF MEDICINE
758 9,988 414,043 UA/NA UA/NA 9,155 3,000 NEW YORK PUBLIC
61 1,657 42,426 31,548 36,371 50,632 752 NEW YORK STATE
1,057 4,073 57,385 40,913 232,182 5,346 6,079 SMITHSONIAN
Figures in italics are derived from a sampling method rather than an actual count.
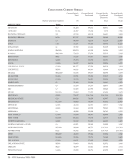
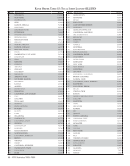
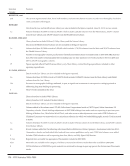
Summary Data
Library
Presentations
to Groups
Participants
in Group
Presentations
Reference
Transactions
Initial
Circulation
Transactions
Total
Circulation
Transactions
Total Items
Loaned (ILL)
Total Items
Borrowed
(ILL)
(30) (31) (32) (33) (34) (35) (36) (Survey Question Number)
University Libraries
1,003 17,619 72,622 315,348 575,892 39,855 32,109 Mean
877 15,384 61,258 244,382 423,657 35,424 28,258 Median
3,007 56,172 328,421 1,442,098 2,513,529 178,255 97,626 High
174 2,980 12,310 43,661 56,984 6,843 4,764 Low
112,344 1,973,311 7,915,841 34,688,244 65,075,780 4,543,485 3,660,400 Totals
112 112 109 110 113 114 114 Number of Libraries Reporting
Nonuniversity Libraries
188 4,073 73,863 59,987 146,207 31,325 2,192 Median
17,772 419,479 2,355,055 4,838,320 4,152,941 423,574 32,316 Totals
9 9 8 8 7 9 8 Number of Libraries Reporting
130,116 2,392,790 10,270,896 39,526,564 69,228,721 4,967,059 3,692,716 GRAND TOTALS