Research Library Trends Tables and Graphs · 19
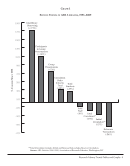
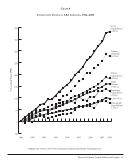
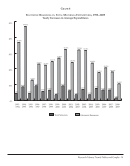
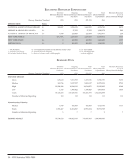
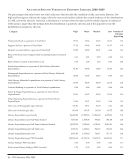
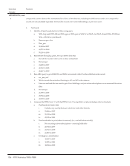
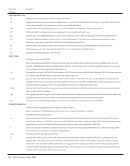
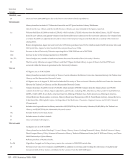
Graph 6
Electronic Resources vs .Total Materials Expenditures, 1993–2009
Yearly Increases in Average Expenditures
0%
10%
20%
30%
40%
50%
Electronic Resources Total Materials
2008-
2009
2007-
2008
2006-
2007
2005-
2006
2004-
2005
2003-
2004
2002-
2003
2001-
2002
2000-
2001
1999-
2000
1998-
1999
1997-
1998
1996-
1997
1995-
1996
1994-
1995
1993-
1994
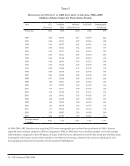
4.32%
37.28%
8.48%
47.46%
4.18%
12.86%
9.18%
23.22%
5.53%
22.50%
6.35%
24.81%
27.06%
32.69%
24.29%
32.34% 31.99%
23.85%
17.72%
20.78%
18.16%
3.40%
9.12%
5.92%
3.38%
6.93%
3.39%
7.53%
6.42% 6.44%
10.58%
0.95%
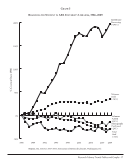
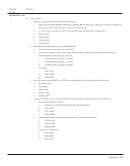
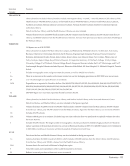
Graph 6
Electronic Resources vs .Total Materials Expenditures, 1993–2009
Yearly Increases in Average Expenditures
0%
10%
20%
30%
40%
50%
Electronic Resources Total Materials
2008-
2009
2007-
2008
2006-
2007
2005-
2006
2004-
2005
2003-
2004
2002-
2003
2001-
2002
2000-
2001
1999-
2000
1998-
1999
1997-
1998
1996-
1997
1995-
1996
1994-
1995
1993-
1994
4.32%
37.28%
8.48%
47.46%
4.18%
12.86%
9.18%
23.22%
5.53%
22.50%
6.35%
24.81%
27.06%
32.69%
24.29%
32.34% 31.99%
23.85%
17.72%
20.78%
18.16%
3.40%
9.12%
5.92%
3.38%
6.93%
3.39%
7.53%
6.42% 6.44%
10.58%
0.95%