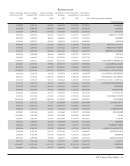
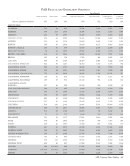
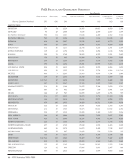
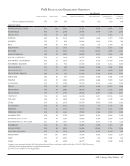
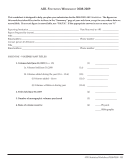
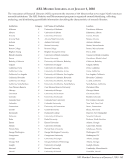
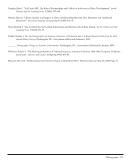
Research Library Trends Tables and Graphs · 13
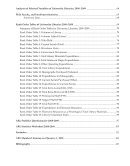
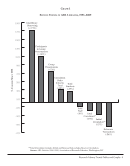
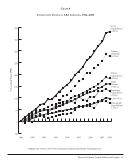
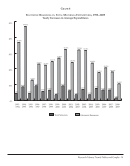
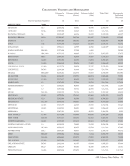
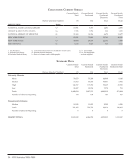
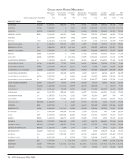
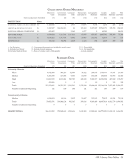
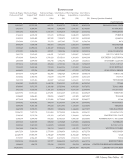
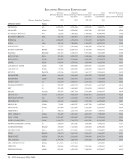
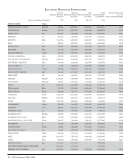
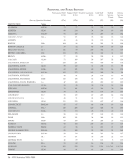
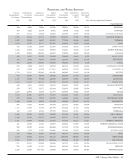
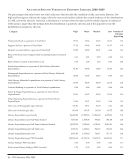
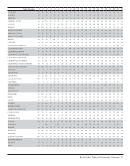
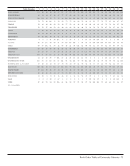
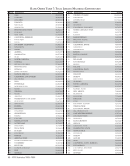
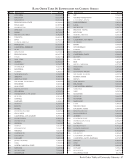
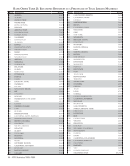
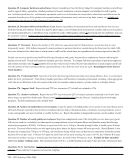
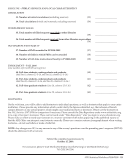
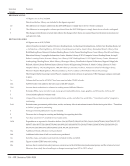
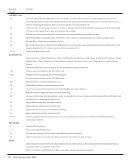
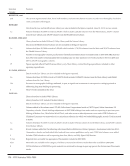
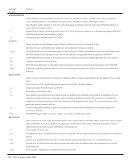
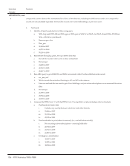
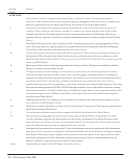
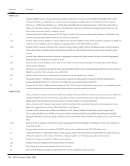
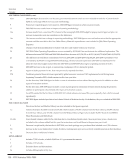
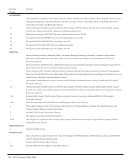
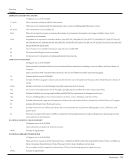
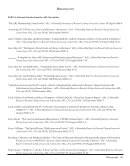
Graph 3
Supply and Demand in ARL Libraries, 1986–2009*
-25%
0%
25%
50%
75%
100%
125%
150%
175%
200%
225%
250%
275%
300%
Monographs
Purchased
(+6%)
Faculty
(+40%)
Total
Students
(+27%)
Graduate
Students
(+120%)
Interlibrary
Lending
(+121%)
Interlibrary
Borrowing
(+300%)
2009 2007 2004 2001 1998 1995 1992 1989 1986
*Serial and monograph data includes electronic resources from 1999–2000 onward.
Source: ARL Statistics 2008–2009, Association of Research Libraries, Washington, DC
%
ChangeSice196
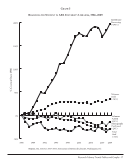
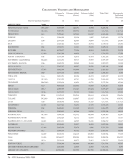
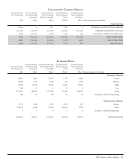
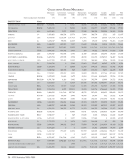
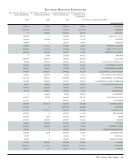
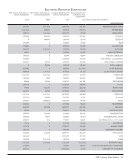
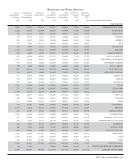
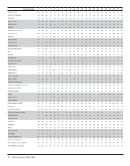
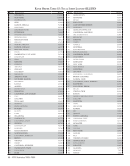
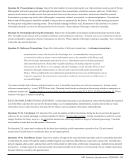
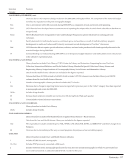
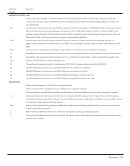
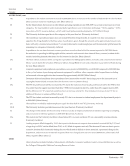
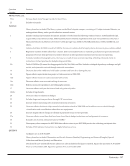
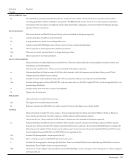
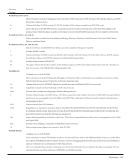