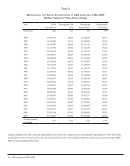
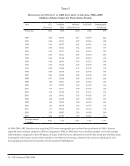
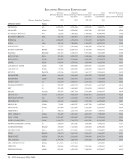
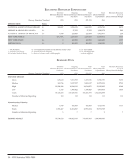
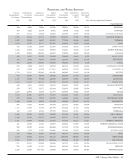
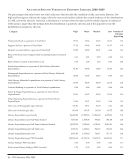
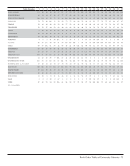
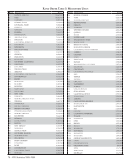
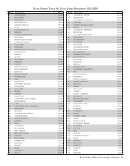
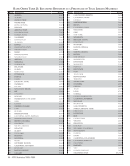
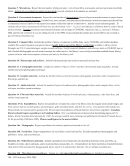
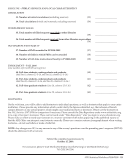
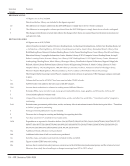
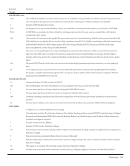
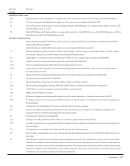
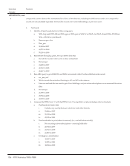
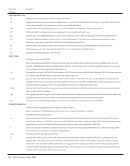
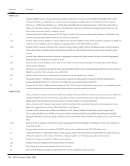
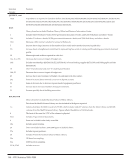
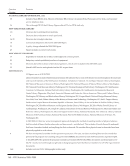
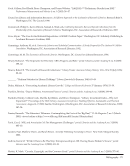
46 · ARL Statistics 2008–2009
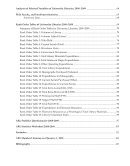
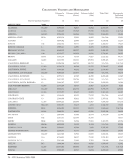
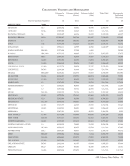
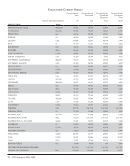
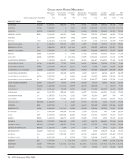
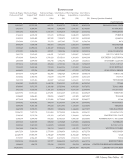
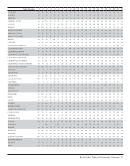
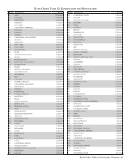
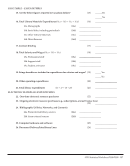
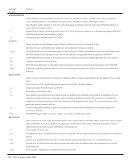
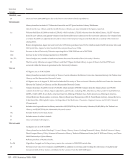
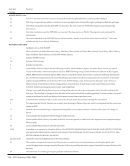
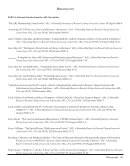
Expenditures
Monographs Current Serials Other Library
Materials
Miscellaneous
Materials
Total Library
Materials
Contract
Binding
(Survey Question Number) (16a) (16b) (16c) (16d) (16) (17)
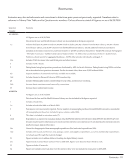
INSTITUTION Notes
NATIONAL AGRICULTURAL LIBRARY G+ 356,019 2,784,103 985,627 0 4,125,750 0
LIBRARY &ARCHIVES CANADA G+ 473,341 536,569 113,761 176,701 1,300,372 UA/NA
NATIONAL LIBRARY OF MEDICINE G+ 1,159,589 8,057,753 115,817 88,258 9,421,417 154,519
NEW YORK PUBLIC +6,075,630 3,535,577 3,047,605 UA/NA 12,658,812 655,477
NEW YORK STATE G+ 916,261 2,520,222 UA/NA 0 3,436,483 9,600
SMITHSONIAN G+ 304,086 1,187,847 0 51,588 1,543,521 1,392
+-See Footnotes G -Government documents not included in serials count U/A -Unavailable
L -Includes Law library B -Includes branch campuses N/A -Not Applicable
M- Includes Medical library b – Basis of volume count is bibliographic .-no data supplied
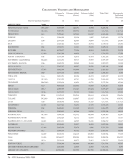
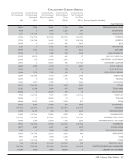
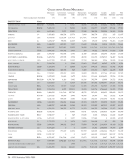
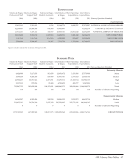
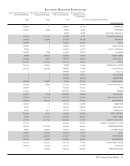
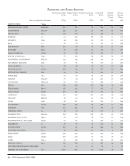
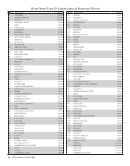
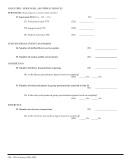
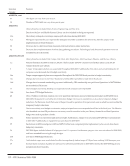
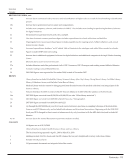
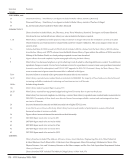
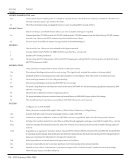
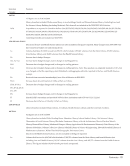
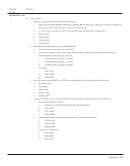
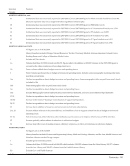
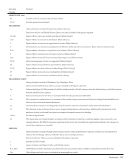
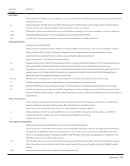
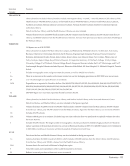
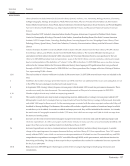
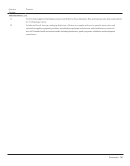
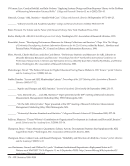
Summary Data
Monographs Current Serials Other Library
Materials
Miscellaneous
Materials
Total Library
Materials
Contract
Binding
(Survey Question Number) (16a) (16b) (16c) (16d) (16) (17)
University Libraries
Mean 2,574,673 7,577,613 1,161,527 403,987 11,596,797 150,125
Median 2,056,586 7,192,136 331,634 295,696 10,274,939 101,952
High 15,345,869 15,015,672 18,089,322 2,877,304 39,105,895 1,061,257
Low 244,960 3,445,792 0 0 4,073,010 6,200
Totals 290,938,016 856,270,302 124,283,336 43,630,606 1,322,034,898 17,114,243
Number of Libraries Reporting 113 113 107 108 114 114
Nonuniversity Libraries
Median 916,261 2,520,222 918,850 44,106 4,125,750 13,609
Totals 18,887,059 25,277,208 14,174,489 434,948 58,773,705 2,322,324
Number of Libraries Reporting 9 9 8 8 9 7
GRAND TOTALS 309,825,075 881,547,511 138,457,826 44,065,554 1,380,808,603 19,436,567
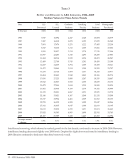
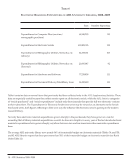
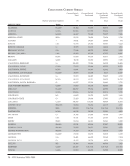
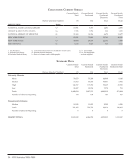
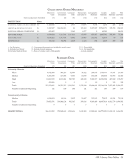
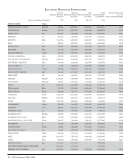
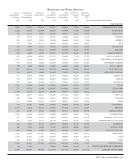
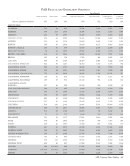
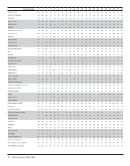
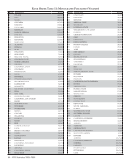
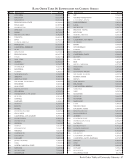
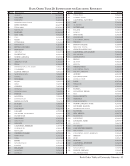
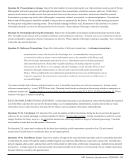
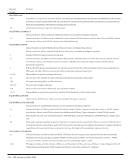
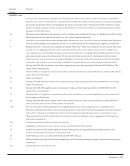
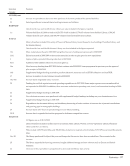
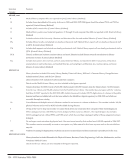
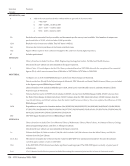
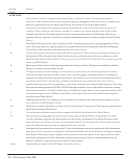
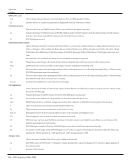
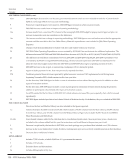
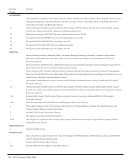
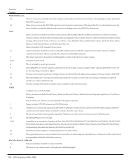
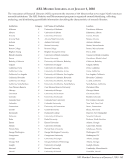
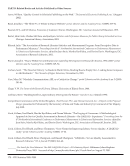
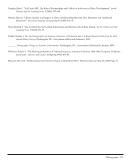
Expenditures
Monographs Current Serials Other Library
Materials
Miscellaneous
Materials
Total Library
Materials
Contract
Binding
(Survey Question Number) (16a) (16b) (16c) (16d) (16) (17)
INSTITUTION Notes
NATIONAL AGRICULTURAL LIBRARY G+ 356,019 2,784,103 985,627 0 4,125,750 0
LIBRARY &ARCHIVES CANADA G+ 473,341 536,569 113,761 176,701 1,300,372 UA/NA
NATIONAL LIBRARY OF MEDICINE G+ 1,159,589 8,057,753 115,817 88,258 9,421,417 154,519
NEW YORK PUBLIC +6,075,630 3,535,577 3,047,605 UA/NA 12,658,812 655,477
NEW YORK STATE G+ 916,261 2,520,222 UA/NA 0 3,436,483 9,600
SMITHSONIAN G+ 304,086 1,187,847 0 51,588 1,543,521 1,392
+-See Footnotes G -Government documents not included in serials count U/A -Unavailable
L -Includes Law library B -Includes branch campuses N/A -Not Applicable
M- Includes Medical library b – Basis of volume count is bibliographic .-no data supplied
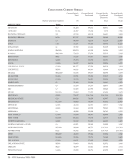
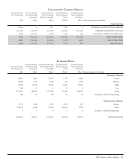
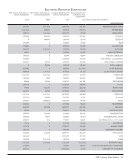
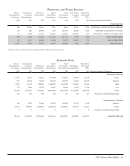
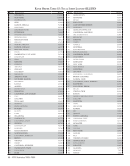
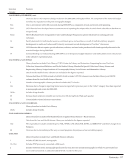
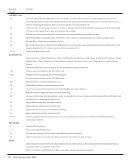
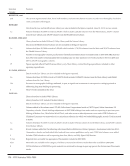
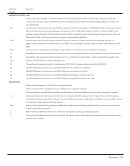
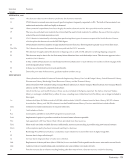
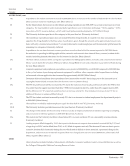
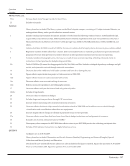
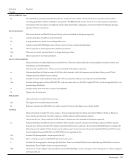
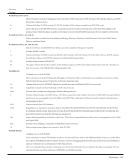
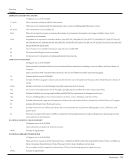
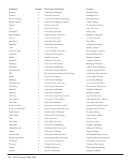
Summary Data
Monographs Current Serials Other Library
Materials
Miscellaneous
Materials
Total Library
Materials
Contract
Binding
(Survey Question Number) (16a) (16b) (16c) (16d) (16) (17)
University Libraries
Mean 2,574,673 7,577,613 1,161,527 403,987 11,596,797 150,125
Median 2,056,586 7,192,136 331,634 295,696 10,274,939 101,952
High 15,345,869 15,015,672 18,089,322 2,877,304 39,105,895 1,061,257
Low 244,960 3,445,792 0 0 4,073,010 6,200
Totals 290,938,016 856,270,302 124,283,336 43,630,606 1,322,034,898 17,114,243
Number of Libraries Reporting 113 113 107 108 114 114
Nonuniversity Libraries
Median 916,261 2,520,222 918,850 44,106 4,125,750 13,609
Totals 18,887,059 25,277,208 14,174,489 434,948 58,773,705 2,322,324
Number of Libraries Reporting 9 9 8 8 9 7
GRAND TOTALS 309,825,075 881,547,511 138,457,826 44,065,554 1,380,808,603 19,436,567