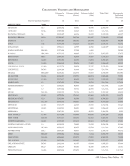
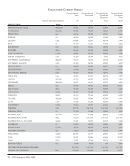
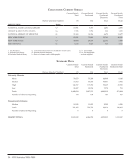
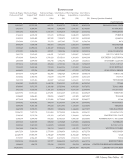
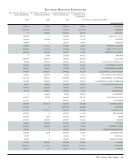
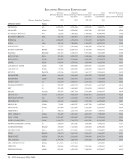
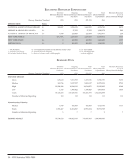
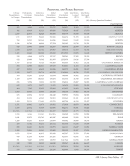
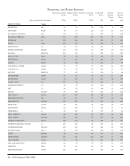
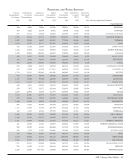
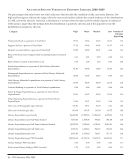
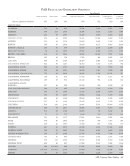
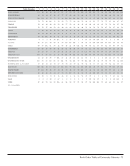
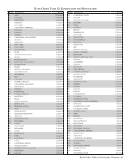
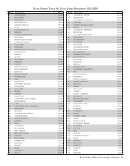
114 · ARL Statistics 2008–2009
Question
Number
Footnote
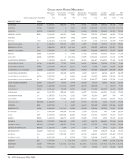
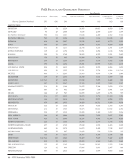
BRIGHAM YOUNG
All figures are as of 12/31/2008.
Data from the Law Library are included in the figures reported.
1.b The difference in volumes added from the 2007-2008 figure is simply due to fewer e-books cataloged.
3 The difference in monographic volumes purchased from the 2007-2008 figure is simply due to fewer e-books catalogued.
5 The change in distribution of serial titles reflects the change in how these are counted based on the latest instructions for
such given by ARL.
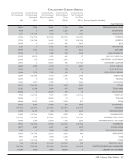
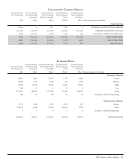
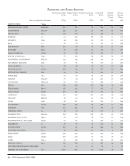
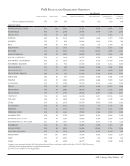
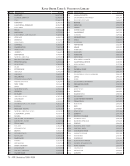
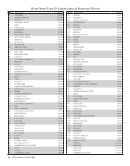
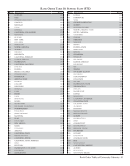
BRITISH COLUMBIA
All figures are as of 03/31/2009.
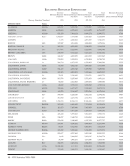
Library branches included: Applied Sciences Reading Room, Archaeology Reading Room, Architecture Reading Room, Art
+Architecture +Planning library, Art History Visual Resources Centre, Asian Library, Biomedical Branch Library, B’nai
Brith Reading Room, Botanical Gardens Reading Room, Coolie Verner Reading Room, Crane Library, David Lam Library,
Education Library, Geographic Information Centre, Hamber Library, ICICS/Computer Science Reading Room, Irving K.
Barber Learning Centre, Koerner Library, Law Library, LERC Reading Room, LLED Digital Literacy Centre, Museum of
Anthropology Reading Room, Music Library, Okanagan Library, Rare Books &Special Collections, Regent College John
Richard Allison Library, Robson Square Library, Science &Engineering Division, St. Mark’s College Library, St. Paul’s
Hospital Library, TAG Reading Room, TRIUMF Library, University Archives, Vancouver School of Theology Library,
Womens’ Studies Reading Room, Woodward Library, Xwi7xwa Library (First Nations House of Learning).
The Irving K. Barber Learning Centre Phase 2 completed its first full year of operations. UBC Okanagan campus continued
to grow.
1.a Volumes held revised to 6,218,261. New base count includes 178,000 e-books.
1.b.i 41,454 e-books were added to the title count of 101,485 volumes.
1.b.ii Increase due to reductions in volumes in reading rooms/affiliated libraries.
2 Excludes cIRcle, many microform sets, many government publications, maps, graphic, and University Archives-AV.
3 Count includes physical volumes only.
5.a.i Unique titles exclude most government publications, serials, and other free serial titles. “Transition to online” program is
continuing.
5.a.ii Excludes some government publications, serials, and many titles in microform formats. Reduction in print titles -“Transition
to Online” program is continuing.
6 Some government publications may be included.
9 Decrease due to change in counting methodology for reporting data files.
13 New base count for LP’s resulted in fewer audio units.
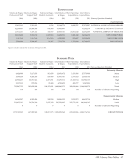
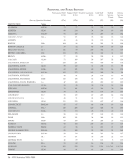
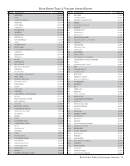
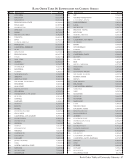
16-26 Expenditures as reported in Canadian dollars: (16a) $4,256,845 (16b) $12,941,503 (16c) $0 (16d) $729,869 (16) $17,928,217 (17)
$189,075 (18a) $9,557,328 (18b) $7,556,960 (18c) $936,265 (18) $18,050,553 (20) $4,579,849 (21) $40,747,694 (22) $243,839 (23)
$10,514,793 (24a) $983,534 (24b) $729,869 (25) $1,148,309 (26) $115,809.
16.a Additional e-book collections were purchased.
16.b Additional collections of full text serials were purchased.
16.c Backfiles, maps, and audiovisual materials included in Q16a and Q16b.
16.d Figure includes CRKN external funding.
18.a Increase due to contractual salary increases, an increase in the FTE librarian/professional group, and the return of several
librarians from study leave (resulting in a change in earnings from 80% to 100% salary).
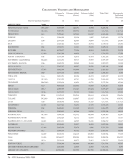
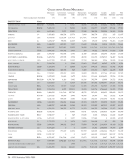
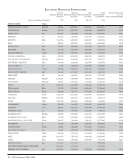
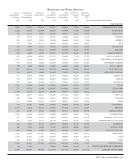
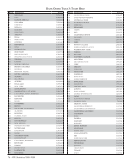
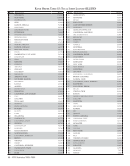
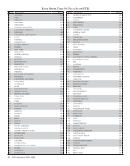
Question
Number
Footnote
BRIGHAM YOUNG
All figures are as of 12/31/2008.
Data from the Law Library are included in the figures reported.
1.b The difference in volumes added from the 2007-2008 figure is simply due to fewer e-books cataloged.
3 The difference in monographic volumes purchased from the 2007-2008 figure is simply due to fewer e-books catalogued.
5 The change in distribution of serial titles reflects the change in how these are counted based on the latest instructions for
such given by ARL.
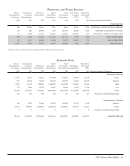
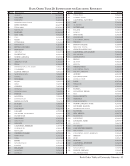
BRITISH COLUMBIA
All figures are as of 03/31/2009.
Library branches included: Applied Sciences Reading Room, Archaeology Reading Room, Architecture Reading Room, Art
+Architecture +Planning library, Art History Visual Resources Centre, Asian Library, Biomedical Branch Library, B’nai
Brith Reading Room, Botanical Gardens Reading Room, Coolie Verner Reading Room, Crane Library, David Lam Library,
Education Library, Geographic Information Centre, Hamber Library, ICICS/Computer Science Reading Room, Irving K.
Barber Learning Centre, Koerner Library, Law Library, LERC Reading Room, LLED Digital Literacy Centre, Museum of
Anthropology Reading Room, Music Library, Okanagan Library, Rare Books &Special Collections, Regent College John
Richard Allison Library, Robson Square Library, Science &Engineering Division, St. Mark’s College Library, St. Paul’s
Hospital Library, TAG Reading Room, TRIUMF Library, University Archives, Vancouver School of Theology Library,
Womens’ Studies Reading Room, Woodward Library, Xwi7xwa Library (First Nations House of Learning).
The Irving K. Barber Learning Centre Phase 2 completed its first full year of operations. UBC Okanagan campus continued
to grow.
1.a Volumes held revised to 6,218,261. New base count includes 178,000 e-books.
1.b.i 41,454 e-books were added to the title count of 101,485 volumes.
1.b.ii Increase due to reductions in volumes in reading rooms/affiliated libraries.
2 Excludes cIRcle, many microform sets, many government publications, maps, graphic, and University Archives-AV.
3 Count includes physical volumes only.
5.a.i Unique titles exclude most government publications, serials, and other free serial titles. “Transition to online” program is
continuing.
5.a.ii Excludes some government publications, serials, and many titles in microform formats. Reduction in print titles -“Transition
to Online” program is continuing.
6 Some government publications may be included.
9 Decrease due to change in counting methodology for reporting data files.
13 New base count for LP’s resulted in fewer audio units.
16-26 Expenditures as reported in Canadian dollars: (16a) $4,256,845 (16b) $12,941,503 (16c) $0 (16d) $729,869 (16) $17,928,217 (17)
$189,075 (18a) $9,557,328 (18b) $7,556,960 (18c) $936,265 (18) $18,050,553 (20) $4,579,849 (21) $40,747,694 (22) $243,839 (23)
$10,514,793 (24a) $983,534 (24b) $729,869 (25) $1,148,309 (26) $115,809.
16.a Additional e-book collections were purchased.
16.b Additional collections of full text serials were purchased.
16.c Backfiles, maps, and audiovisual materials included in Q16a and Q16b.
16.d Figure includes CRKN external funding.
18.a Increase due to contractual salary increases, an increase in the FTE librarian/professional group, and the return of several
librarians from study leave (resulting in a change in earnings from 80% to 100% salary).