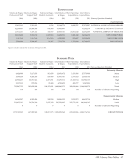
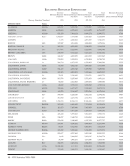
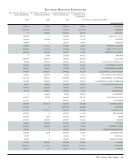
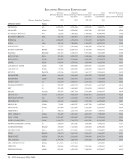
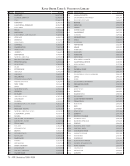
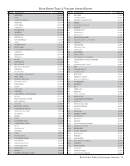
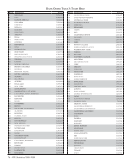
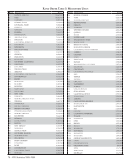
8 · ARL Statistics 2008–2009 Table 1 Service Trends in ARL Libraries, 1991–2009 Median Values for Time-Series Trends Year ILL: Borrowed Group Pres. Participants In Pres. Reference Trans. Initial Circ. Total Circ. Ratio of Init./Tot. Total Staff Total Students (Libraries) (103) (84) (82) (79) (36) (80) (34) (105) (103) 1991 10,397 508 7,137 125,103 296,964 509,673 1.26 271 18,290 1992 11,362 526 7,154 132,549 342,989 554,579 1.27 265 18,273 1993 12,489 616 7,688 136,115 343,293 568,628 1.32 262 18,450 1994 14,007 568 7,831 147,582 369,996 572,749 1.31 264 18,305 1995 14,472 687 8,461 147,023 347,144 578,989 1.32 267 18,209 1996 15,278 719 8,410 155,336 336,481 560,244 1.39 264 18,320 1997 16,264 687 9,218 149,659 348,157 542,438 1.37 273 18,166 1998 17,656 698 9,462 132,850 354,924 514,574 1.37 273 18,335 1999 18,942 711 9,406 128,696 300,923 514,087 1.38 277 18,609 2000 20,475 722 9,596 115,636 273,231 482,542 1.42 267 18,908 2001 21,902 669 10,121 104,409 265,195 467,277 1.48 269 19,102 2002 21,339 776 11,350 95,910 251,146 462,223 1.51 279 19,925 2003 22,146 806 12,516 89,150 248,689 479,733 1.57 277 21,132 2004 25,737 757 12,864 84,546 261,526 496,369 1.60 273 21,562 2005 25,729 803 13,782 65,168 250,971 473,216 1.58 267 22,047 2006 27,412 833 13,051 67,697 267,213 466,403 1.52 267 22,618 2007 26,813 830 14,417 61,703 222,037 456,597 1.59 266 22,874 2008 27,822 803 15,480 58,763 221,144 429,626 1.59 260 22,762 2009 28,187 877 14,958 55,416 218,191 414,482 1.64 249 23,303 Average annual
%change 5.7% 3.1% 4.2% -4.4% -1.7% -1.1% 1.5% -0.5% 1.4% Table 1 presents data about select public service activities such as circulation (initial and total), reference transactions, library instruction (group presentations and participants in these presentations), and interlibrary borrowing and lending. As seen in table 1, for the first time in three years, the median of group presentations increased. However, the number of participants decreased with a median of 14,958 for the typical research library. Perhaps what is of most interest is that by 2009 there were more than double the participants compared to 1991, while there is only a 27% difference in the number of students between 1991 and 2009 (see Graph 1). Graph 1 shows that, cumulatively, total staff decreased by 8% in 2009, which is double the cumulative decrease reported in 2008. Even with continued decreases in total staff, the median of group presentations increased in 2009.
6 · ARL Statistics 2008–2009 Change in Counting Serials For the third year in a row libraries have been instructed to count and report serial titles in the ARL Statistics, rather than subscriptions. As a result, the trend line of publishing serial cost per subscription has been discontinued, and eventually a trend line reflecting the new approach to counting serials will emerge as we aggregate annual data on serial titles. This simple shift is very important as it makes the concept of serials more meaningful in the electronic environment. In the electronic environment, once a library owns or leases a title, the title is often accessible by all users. Therefore, unique titles, rather than subscriptions, is a more authentic descriptive statistic for the scope and content of library collections. A unique title count favors broader coverage. Any duplication of those titles through packages, aggregations, bundles, etc., becomes more a management issue. The new definition asks that serial titles be reported as electronic if available both in print and electronic formats and that they be reported as purchased if available both through purchased and non-purchased arrangements. So, if a serial title appears in both print and electronic form and a library has acquired it through several different providers, it would be counted as one serial title. Training materials have been posted on the ARL website to ensure that there is a well-grounded, shared understanding of the new definitions and counting methodology. What prompted this change? In earlier years libraries were instructed to report the “total number of subscriptions, not titles, but electronic serials acquired as part of an aggregated package (such as MUSE or Academic’s IDEAL) were to be counted by title”. Directors and other staff expressed concern that the serials count was problematic because many libraries engage in multiple consortia arrangements. Counting serials purchased through a bevy of consortial agreements could lead to inflated figures because duplicate titles could be held in multiple packages. The Statistics and Assessment Committee determined that a new way of counting serials that focuses on titles would provide better descriptive data reflecting the true scope of the content provided by research libraries. A pilot at various ARL libraries demonstrated the feasibility of the new method. The shift from counting subscriptions to counting titles further supports ARL’s goal of reporting collectable, useful data in the ARL Statistics. Libraries are reporting more serials titles than they ever managed to report by simply counting serial subscriptions. Although the aforementioned positive outcome demonstrates the success of this semantic and methodological shift, all earlier trend lines that were based on serial subscriptions had to be deleted from the publication in order to bring the graphs in line with the new definition and counting methodology. A variety of resources have been developed for libraries to consult as they implement this change, and they are available on the ARL Website at http://www.arl.org/stats/annualsurveys/arlstats/09statmail.shtml. In 2007–2008, we changed the categories of serials reported under “serials titles currently received but not purchased.” The subcategories are now: (a) consortial, (b) freely accessible, (c) print (and other formats) -exchanges, gifts, etc., and (d) government documents. These categories are more meaningful in the context of “serials titles received,” as they emphasize major components of that concept.