152 Representative Documents: Sharing Collection Data
UNIVERSITY OF OREGON LIBRARIES
Statistical Abstract, 2013–2014 (excerpts)
https://scholarsbank.uoregon.edu/xmlui/handle/1794/18807
STATISTICAL ABSTRACT 2013–14
Page 16
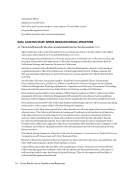
Assessment: Learning From and About Library Users
Usability Studies/Assessing Learning Management System Options
The LMS review process is noted in detail later in this document. It included extensive
pilot testing, surveys, focus groups, and usability testing.
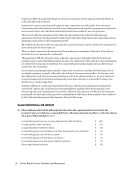
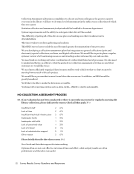
Surveying User Satisfaction/LibQual+
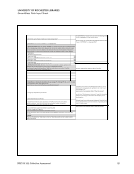
The Assessment Team’s major project for the last academic year was conducting the
LibQual+ survey. The survey was previously conducted in 2005 and 2010. We had
an overall response rate of just 7%, in spite of multiple reminder messages. (The
response rate was 11% in 2010.) The faculty response rate was 9%, graduate students
15%, and undergraduates 5%. We conducted a representativeness check comparing
respondents with the overall campus population by discipline.
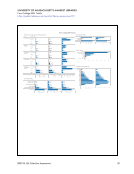
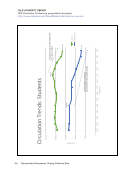
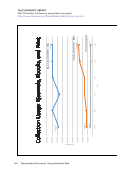
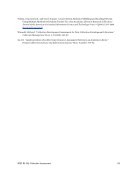
In this round the perceived level of service improved slightly along all three major
dimensions:
• Affect of Service (how users feel they are treated)
• Information Control (library collections, website, and discovery tools)
• Library as Place (physical facilities)
Additional findings are reported in the summary online at https://library.uoregon.
edu/sites/default/files/node156/libqual_summary_report.docx, with the full report
from the Association of Research Libraries in Scholars’ Bank.
Perceived Level of Service LibQUAL+ Survey two.lfzero.lfzero.lffive.lf–two.lfzero.lfone.lffour.lf
two.lf
four.lf
six.lf
eight.lf
AYtwo.lfzero.lfzero.lffive.lf AYtwo.lfzero.lfone.lffour.lf AYtwo.lfzero.lfone.lfzero.lf
one.lf
three.lf
five.lf
seven.lf
nine.lf
AuniFB00ect of Service
Information Control
Library as Place
Rating
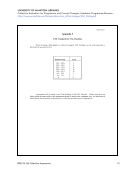
Fig. 23 Perceived Level of Service LibQUAL+ Survey 2005–2014
UNIVERSITY OF OREGON LIBRARIES
Statistical Abstract, 2013–2014 (excerpts)
https://scholarsbank.uoregon.edu/xmlui/handle/1794/18807
STATISTICAL ABSTRACT 2013–14
Page 16
Assessment: Learning From and About Library Users
Usability Studies/Assessing Learning Management System Options
The LMS review process is noted in detail later in this document. It included extensive
pilot testing, surveys, focus groups, and usability testing.
Surveying User Satisfaction/LibQual+
The Assessment Team’s major project for the last academic year was conducting the
LibQual+ survey. The survey was previously conducted in 2005 and 2010. We had
an overall response rate of just 7%, in spite of multiple reminder messages. (The
response rate was 11% in 2010.) The faculty response rate was 9%, graduate students
15%, and undergraduates 5%. We conducted a representativeness check comparing
respondents with the overall campus population by discipline.
In this round the perceived level of service improved slightly along all three major
dimensions:
• Affect of Service (how users feel they are treated)
• Information Control (library collections, website, and discovery tools)
• Library as Place (physical facilities)
Additional findings are reported in the summary online at https://library.uoregon.
edu/sites/default/files/node156/libqual_summary_report.docx, with the full report
from the Association of Research Libraries in Scholars’ Bank.
Perceived Level of Service LibQUAL+ Survey two.lfzero.lfzero.lffive.lf–two.lfzero.lfone.lffour.lf
two.lf
four.lf
six.lf
eight.lf
AYtwo.lfzero.lfzero.lffive.lf AYtwo.lfzero.lfone.lffour.lf AYtwo.lfzero.lfone.lfzero.lf
one.lf
three.lf
five.lf
seven.lf
nine.lf
AuniFB00ect of Service
Information Control
Library as Place
Rating
Fig. 23 Perceived Level of Service LibQUAL+ Survey 2005–2014