Data Tables · 59
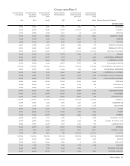
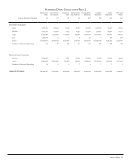
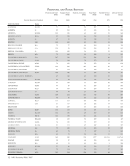
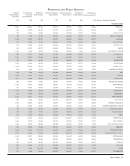
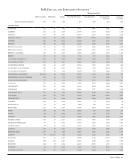
Personnel and Public Services
Library
Presentations
to Groups
Participants
in Group
Presentations
Reference
Transactions
Initial Circulation
Transactions
Total Circulation
Transactions
Total Items
Loaned (ILL)
Total Items
Borrowed (ILL)
(29) (30) (31) (32) (33) (34) (35) (Survey Question Number)
University Libraries
947 16,719 85,984 348,205 605,332 39,169 29,836 Mean
832 14,337 67,827 268,354 446,035 35,838 26,813 Median
3,031 59,098 523,740 1,908,310 2,971,834 173,771 89,193 High
121 1,761 0 90,160 90,160 5,038 3,114 Low
105,075 1,855,767 9,372,217 38,302,547 68,402,494 4,426,064 3,371,486 Totals
111 111 109 110 113 113 113 Number of Libraries Reporting
Nonuniversity Libraries
658 11,414 79,535 91,856 127,493 30,932 1,219 Median
21,780 471,759 2,954,471 3,519,786 3,758,178 935,058 49,759 Totals
9 9 9 9 9 10 10 Number of Libraries Reporting
126,855 2,327,526 12,326,688 41,822,333 72,160,672 5,361,122 3,421,245 GRANDd TOTALS
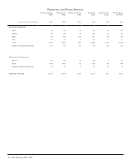
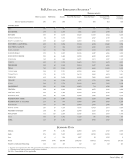