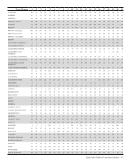
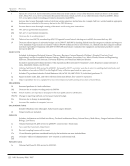
10 · ARL Statistics 2006–2007
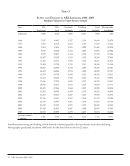
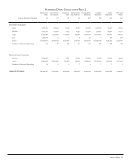
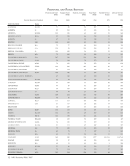
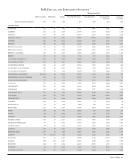
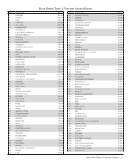
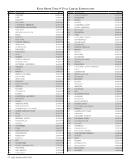
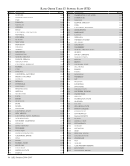
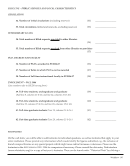
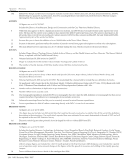
Table 2
Median Monograph and Serial Expenditures in ARL Libraries, 1986–2007
Median Values for Time-Series Trends
Year Serial
Expenditures
Monograph
Unit Cost
Monograph
Expenditures
Monographs
Purchased
(Libraries) (100) (57) (97) (58)
1986 $1,496,775 $29.28 $1,120,645 32,679
1987 $1,769,960 $31.76 $1,064,484 26,240
1988 $1,947,559 $36.03 $1,141,226 25,238
1989 $2,113,976 $38.44 $1,106,073 27,082
1990 $2,296,910 $41.44 $1,330,747 27,546
1991 $2,548,687 $42.60 $1,400,738 27,843
1992 $2,620,832 $44.14 $1,353,865 26,947
1993 $2,918,569 $43.74 $1,295,807 25,188
1994 $2,912,495 $44.72 $1,309,807 25,341
1995 $3,131,033 $45.27 $1,365,575 25,707
1996 $3,389,118 $46.73 $1,444,015 25,911
1997 $3,642,541 $46.42 $1,460,234 28,576
1998 $3,816,497 $47.59 $1,486,764 24,447
1999 $4,095,934 $47.78 $1,506,651 25,173
2000 $4,430,812 $47.87 $1,657,349 28,024
2001 $4,660,349 $48.48 $1,864,023 30,494
2002 $4,939,225 $50.61 $1,812,826 31,578
2003 $5,392,007 $52.83 $1,873,157 33,208
2004 $5,580,157 $51.36 $1,839,412 30,155
2005 $5,962,446 $53.57 $1,784,841 30,546
2006 $6,307,292 $52.04 $2,044,272 33,145
2007 $6,587,241 $54.17 $2,097,078 36,462
Average annual
%change
7.3% 3.0% 3.0% 0.5%
Note that Table 2 and Graph 2 have been revised since 2005–2006 and no longer include Serial Unit Cost or Serial
Subscriptions. Beginning with 2006–2007, ARL libraries are reporting unduplicated counts of serial titles rather than
subscriptions.
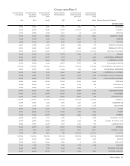
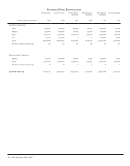
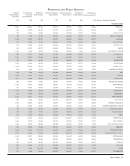
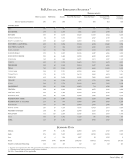
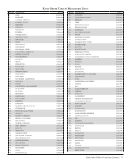
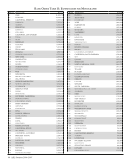
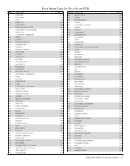
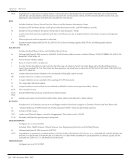