38 · ARL Statistics 2013–2014
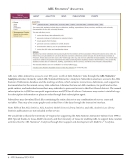
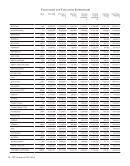
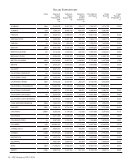
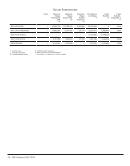
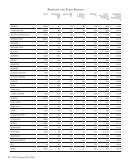
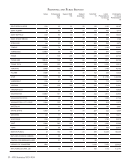
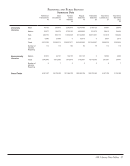
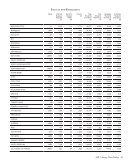
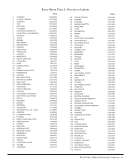
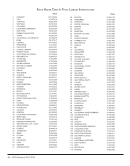
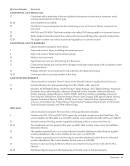
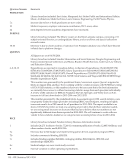
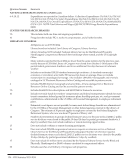
Analysis of Selected Variables of University Libraries, 2013–2014
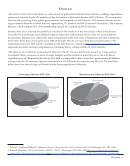
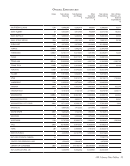
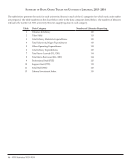
The percentages and ratios below are select indicators that describe the condition of ARL university libraries. The
high and low figures indicate the range, while the mean and median indicate the central tendency of the distributions
for ARL university libraries. Note that a distribution is normal when the mean and the median figures are identical.
If the mean is larger than the median, then the distribution is positively skewed, and if the opposite is true, the
distribution is negatively skewed.the
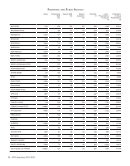
Category
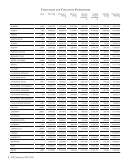
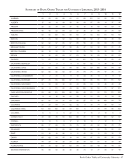
The percentages and ratios below are select indicators that describe the condition of ARL university libraries. The high and low
figures indicate the range, while the mean and median indicate the central tendency of the distributions for ARL university libraries.
Note that a distribution is normal when the mean and the median figures are identical. If the mean is larger than the median then the
distribution is positively skewed, and if opposite is true the distribution is negatively skewed.
High Mean Median Low Number of
Libraries
Reporting
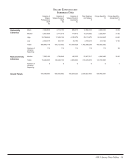
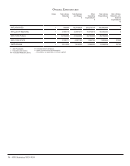
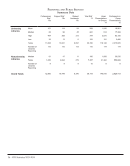
Professional Staff as a precent of Total Staff 60.00 37.69 37.64 22.01 115
Support Staff as a precent of Total Staff 69.16 42.86 43.02 12.38 115
Student Assistant Staff as a precent of Total Staff 54.37 19.97 20.16 0.88 112
Ratio of Professional to Support Staff (excluding Student Assistant
Staff)
4.85 1.01 0.88 0.40 115
Ratio of Items Loaned to Items Borrowed 4.39 1.41 1.19 0.24 114
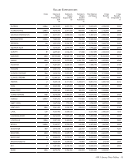
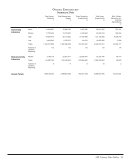
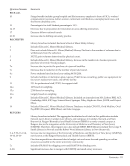
Total Library Materials Expenditures as a precent of Total Library
Expenditures
62.67 46.43 47.76 29.58 115
Salary and Wages Expenditures as a precent of Total Library
Expenditures
58.47 42.69 42.48 30.40 115
Other Operating Expenditures as a precent of Total Library
Expenditures
33.67 10.88 9.94 1.26 115
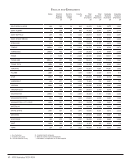
Library Expenditures per Faculty 74,088.60 18,151.28 16,458.28 6,857.90 115
Library Expenditures per Full-Time Student 7,343.47 1,327.02 994.52 353.46 115
Library Expenditures per Full-Time Graduate Student 19,053.27 5,225.33 4,634.52 2,441.64 115
Library Expenditures per Full-Time User 6,065.48 1,216.96 918.55 338.83 115
Library Expenditures per User 5,989.98 1,064.57 751.13 246.75 115
Library Expenditures per PhD Awarded 502,399.20 60,550.63 49,572.14 15,889.97 115
Library Staff per PhD Awarded 4.53 0.55 0.43 0.16 115
Professional Library Staff per PhD Awarded 1.73 0.20 0.17 0.04 115
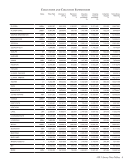
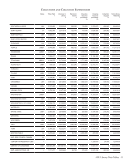
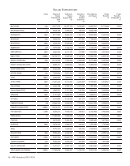
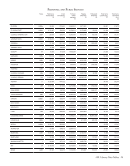
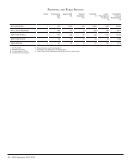
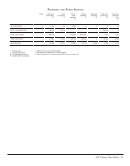
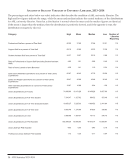
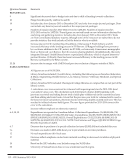
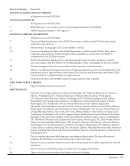
Analysis of Selected Variables of University Libraries, 2013–2014
The percentages and ratios below are select indicators that describe the condition of ARL university libraries. The
high and low figures indicate the range, while the mean and median indicate the central tendency of the distributions
for ARL university libraries. Note that a distribution is normal when the mean and the median figures are identical.
If the mean is larger than the median, then the distribution is positively skewed, and if the opposite is true, the
distribution is negatively skewed.the
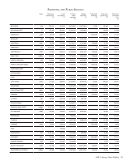
Category
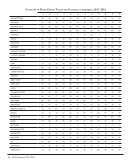
The percentages and ratios below are select indicators that describe the condition of ARL university libraries. The high and low
figures indicate the range, while the mean and median indicate the central tendency of the distributions for ARL university libraries.
Note that a distribution is normal when the mean and the median figures are identical. If the mean is larger than the median then the
distribution is positively skewed, and if opposite is true the distribution is negatively skewed.
High Mean Median Low Number of
Libraries
Reporting
Professional Staff as a precent of Total Staff 60.00 37.69 37.64 22.01 115
Support Staff as a precent of Total Staff 69.16 42.86 43.02 12.38 115
Student Assistant Staff as a precent of Total Staff 54.37 19.97 20.16 0.88 112
Ratio of Professional to Support Staff (excluding Student Assistant
Staff)
4.85 1.01 0.88 0.40 115
Ratio of Items Loaned to Items Borrowed 4.39 1.41 1.19 0.24 114
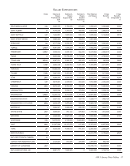
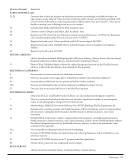
Total Library Materials Expenditures as a precent of Total Library
Expenditures
62.67 46.43 47.76 29.58 115
Salary and Wages Expenditures as a precent of Total Library
Expenditures
58.47 42.69 42.48 30.40 115
Other Operating Expenditures as a precent of Total Library
Expenditures
33.67 10.88 9.94 1.26 115
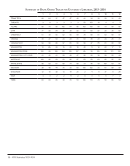
Library Expenditures per Faculty 74,088.60 18,151.28 16,458.28 6,857.90 115
Library Expenditures per Full-Time Student 7,343.47 1,327.02 994.52 353.46 115
Library Expenditures per Full-Time Graduate Student 19,053.27 5,225.33 4,634.52 2,441.64 115
Library Expenditures per Full-Time User 6,065.48 1,216.96 918.55 338.83 115
Library Expenditures per User 5,989.98 1,064.57 751.13 246.75 115
Library Expenditures per PhD Awarded 502,399.20 60,550.63 49,572.14 15,889.97 115
Library Staff per PhD Awarded 4.53 0.55 0.43 0.16 115
Professional Library Staff per PhD Awarded 1.73 0.20 0.17 0.04 115