112 · ARL Statistics 2013–2014
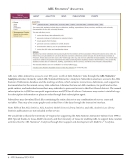
Question Number Footnote
RUTGERS cont.
9 Significant decreased due to budget cuts and due to shift of funding towards collections.
10 Fringe benefits paid by staff for 8a and 8b.
18 Includes data from January 2013 to December 2013 and only from major journal packages. Does
not include any data for journals outside of the major journal packages.
19 Number of regular searches 2011–2012 revised to 5,450,492. Number of regular searches
2012–2013 revised to 3,957,024. These figures are revised based on new information obtained for
analyzing and gathering statistics. Includes data from January 2013 to December 2013. Totals
are from consolidated database reports although some of the resources we subscribe to do not
provide statistics, this total includes all of the data for what is available.
21 Increase due to (1) CIC membership, (2) addition of the George F. Smith Library, and (3)
increased efficiency of the lending process in EZ-Borrow. (1) Rutgers holdings have proven to
be a welcome addition to the CIC in fact, for FY 2014, we lent nearly 5 times more monographs
than we borrowed via UBorrow, the CIC resource sharing platform. (2) Additionally, the newly
integrated George F. Smith library houses a specialized collection, which is of great interest to
partner libraries. (3) Finally, there has been increased efficiency in the lending process in EZ-
Borrow, facilitated by the Relais system.
23, 24 Increase due to merger with UMDNJ and previous exclusion of degrees outside of PhDs.
SASKATCHEWAN
All figures are as of 04/30/2014.
Library branches included: Overall Library, including the following seven branches (Education
&Music, Engineering, Health Sciences, Law, Murray, Science, Veterinary Medicine, and Special
Collections.
Library branches NOT included: Theological College libraries on campus that are not part of the
library system.
2 A calculation error was uncovered for volumes held impacting totals for the 2013–2014 fiscal
year and previous years. The calculation used determined volumes held beginning with
previous year totals and taking the net total of adds plus withdrawals in the current fiscal year
and then adding electronic books. Given that the previous year total for volumes held is used as
the basis for future calculations, electronic books were being double counted each year. This has
resulted in inflated volumes held figures. The new figure provided for 2013–2014 corrects this
error in the calculation.
4 Increase reflects emphasis on electronic material.
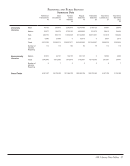
6–9, 10, 12 Expenditures as reported in Canadian dollars. Collections Expenditures: (7a) $2,000,814 (7b)
$10,092,013 (7c) $442,277 (7) $12,535,104 Salary Expenditures: (8a) $5,738,693 (8b) $3,849,057 (8c)
$393,813 (8) $9,981,563 (10) $1,543,151 Overall Expenditures: (7) $12,535,104 (8) $9,981,563 (9)
$1,970,756 (6) $24,487,423 (12) NA/UA. NOTE: Total Salaries and Wages (Q8) EXCLUDES Fringe
Benefits Expenditures (Q10).
6, 7 Decrease due to purchase of a special collection last year ($2,052,454) not included this year.
7.a Decision was made in 2013–2014 fiscal year to put a limit on one-time purchases.
12 No such expenditures this fiscal year.
17 Decrease reflects emphasis on electronic material resulting in decreased circulation of physical
material.
18 Based on the 2013 calendar year. Includes usage for 36,152 titles.
20 University of Saskatchewan does not use a federated search engine.
Question Number Footnote
RUTGERS cont.
9 Significant decreased due to budget cuts and due to shift of funding towards collections.
10 Fringe benefits paid by staff for 8a and 8b.
18 Includes data from January 2013 to December 2013 and only from major journal packages. Does
not include any data for journals outside of the major journal packages.
19 Number of regular searches 2011–2012 revised to 5,450,492. Number of regular searches
2012–2013 revised to 3,957,024. These figures are revised based on new information obtained for
analyzing and gathering statistics. Includes data from January 2013 to December 2013. Totals
are from consolidated database reports although some of the resources we subscribe to do not
provide statistics, this total includes all of the data for what is available.
21 Increase due to (1) CIC membership, (2) addition of the George F. Smith Library, and (3)
increased efficiency of the lending process in EZ-Borrow. (1) Rutgers holdings have proven to
be a welcome addition to the CIC in fact, for FY 2014, we lent nearly 5 times more monographs
than we borrowed via UBorrow, the CIC resource sharing platform. (2) Additionally, the newly
integrated George F. Smith library houses a specialized collection, which is of great interest to
partner libraries. (3) Finally, there has been increased efficiency in the lending process in EZ-
Borrow, facilitated by the Relais system.
23, 24 Increase due to merger with UMDNJ and previous exclusion of degrees outside of PhDs.
SASKATCHEWAN
All figures are as of 04/30/2014.
Library branches included: Overall Library, including the following seven branches (Education
&Music, Engineering, Health Sciences, Law, Murray, Science, Veterinary Medicine, and Special
Collections.
Library branches NOT included: Theological College libraries on campus that are not part of the
library system.
2 A calculation error was uncovered for volumes held impacting totals for the 2013–2014 fiscal
year and previous years. The calculation used determined volumes held beginning with
previous year totals and taking the net total of adds plus withdrawals in the current fiscal year
and then adding electronic books. Given that the previous year total for volumes held is used as
the basis for future calculations, electronic books were being double counted each year. This has
resulted in inflated volumes held figures. The new figure provided for 2013–2014 corrects this
error in the calculation.
4 Increase reflects emphasis on electronic material.
6–9, 10, 12 Expenditures as reported in Canadian dollars. Collections Expenditures: (7a) $2,000,814 (7b)
$10,092,013 (7c) $442,277 (7) $12,535,104 Salary Expenditures: (8a) $5,738,693 (8b) $3,849,057 (8c)
$393,813 (8) $9,981,563 (10) $1,543,151 Overall Expenditures: (7) $12,535,104 (8) $9,981,563 (9)
$1,970,756 (6) $24,487,423 (12) NA/UA. NOTE: Total Salaries and Wages (Q8) EXCLUDES Fringe
Benefits Expenditures (Q10).
6, 7 Decrease due to purchase of a special collection last year ($2,052,454) not included this year.
7.a Decision was made in 2013–2014 fiscal year to put a limit on one-time purchases.
12 No such expenditures this fiscal year.
17 Decrease reflects emphasis on electronic material resulting in decreased circulation of physical
material.
18 Based on the 2013 calendar year. Includes usage for 36,152 titles.
20 University of Saskatchewan does not use a federated search engine.