Research Library Trends Tables and Graphs · 19
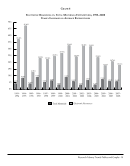
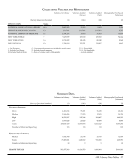
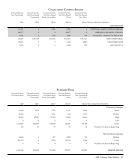
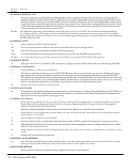
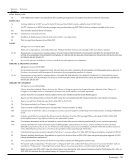
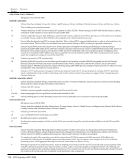
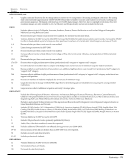
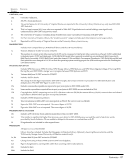
Graph 6
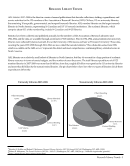
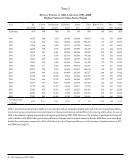
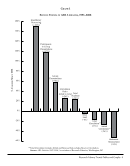
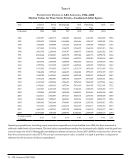
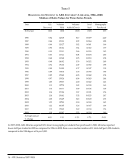
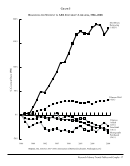
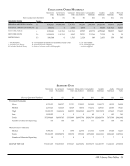
Electronic Resources vs .Total Materials Expenditures, 1993–2008
Yearly Increases in Average Expenditures
0%
5%
10%
15%
20%
25%
30%
35%
40%
45%
50%
Electronic Resources Total Materials
2007–
2008
2006–
2007
2005–
2006
2004–
2005
2003–
2004
2002–
2003
2001–
2002
2000–
2001
1999–
2000
1998–
1999
1997–
1998
1996–
1997
1995–
1996
1994–
1995
1993–
1994
4.32%
37.28%
8.48%
47.46%
4.18%
12.86%
9.18%
23.22%
5.53%
22.50%
6.35%
24.81%
27.06%
32.69%
24.29%
32.34% 31.99%
23.85%
17.72%
20.78%
18.16%
3.40%
9.12%
5.92%
3.38%
6.93%
3.39%
7.53%
6.06% 5.80%
Graph 6
Electronic Resources vs .Total Materials Expenditures, 1993–2008
Yearly Increases in Average Expenditures
0%
5%
10%
15%
20%
25%
30%
35%
40%
45%
50%
Electronic Resources Total Materials
2007–
2008
2006–
2007
2005–
2006
2004–
2005
2003–
2004
2002–
2003
2001–
2002
2000–
2001
1999–
2000
1998–
1999
1997–
1998
1996–
1997
1995–
1996
1994–
1995
1993–
1994
4.32%
37.28%
8.48%
47.46%
4.18%
12.86%
9.18%
23.22%
5.53%
22.50%
6.35%
24.81%
27.06%
32.69%
24.29%
32.34% 31.99%
23.85%
17.72%
20.78%
18.16%
3.40%
9.12%
5.92%
3.38%
6.93%
3.39%
7.53%
6.06% 5.80%