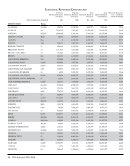
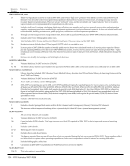
16 · ARL Statistics 2007–2008
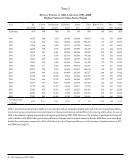
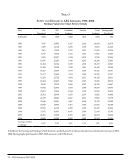
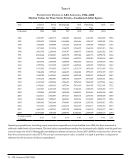
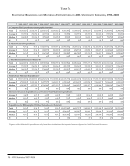
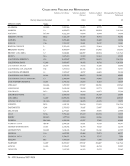
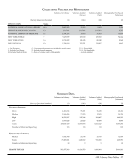
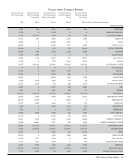
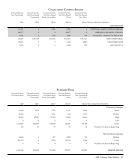
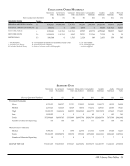
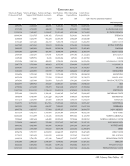
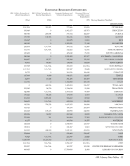
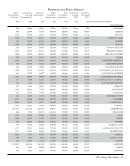
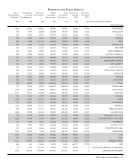
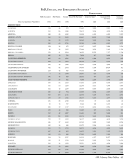
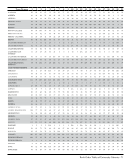
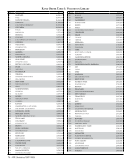
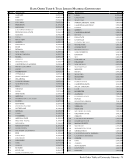
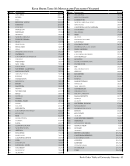
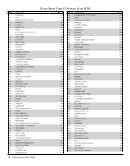
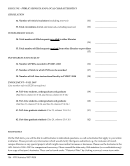
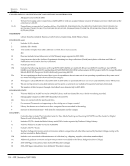
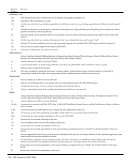
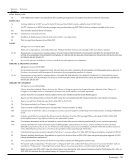
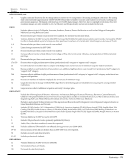
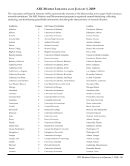
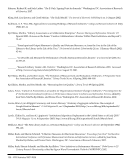
Table 5
Resources per Student in ARL University Libraries, 1986–2008
Median of Ratio Values for Time-Series Trends
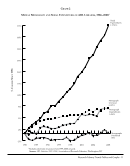
Year ILL:
Borrowed
Volumes
Held
Volumes
Added (Gross)
Total
Staff
Monographs
Purchased
(Libraries) (102) (103) (103) (103) (57)
1986 0.42 123.18 4.17 0.0159 2.20
1987 0.44 125.31 3.92 0.0164 1.88
1988 0.44 128.27 3.82 0.0161 1.66
1989 0.50 130.04 3.84 0.0162 1.77
1990 0.55 133.51 3.86 0.0155 1.83
1991 0.63 137.11 4.04 0.0154 1.86
1992 0.62 137.68 3.95 0.0153 1.58
1993 0.68 146.02 3.76 0.0152 1.49
1994 0.74 151.20 4.07 0.0152 1.55
1995 0.80 154.00 4.37 0.0147 1.59
1996 0.89 158.10 3.78 0.0145 1.48
1997 0.89 159.40 4.03 0.0142 1.52
1998 0.97 159.24 4.06 0.0143 1.44
1999 1.05 159.37 4.00 0.0142 1.42
2000 1.13 157.74 3.82 0.0139 1.63
2001 1.16 155.71 3.89 0.0136 1.69
2002 1.14 155.04 3.87 0.0131 1.54
2003 1.14 156.41 3.52 0.0125 1.47
2004 1.20 151.49 3.45 0.0120 1.53
2005 1.22 157.93 3.30 0.0118 1.42
2006 1.22 160.05 3.26 0.0117 1.64
2007 1.13 159.49 3.49 0.0114 1.54
2008 1.19 162.87 3.22 0.0110 1.40
Average annual
%change
4.8% 1.3% -1.2% -1.7% -2.0%
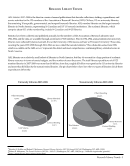
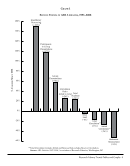
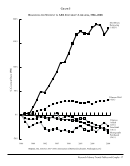
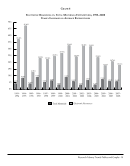
In 2007–2008, ARL libraries acquired 60% fewer monographs per student than purchased in 1986. Libraries reported
fewer staff per student in 2008 as compared to 1986: in 2008, there was a median number of 11 total staff per 1,000 students,
compared to the 1986 figure of 16 per 1,000.
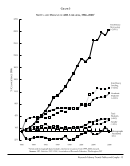
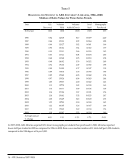
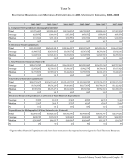
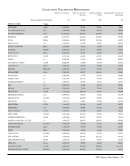
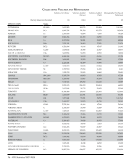
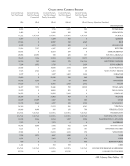
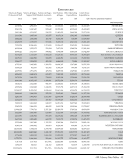
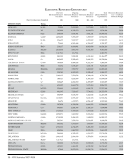
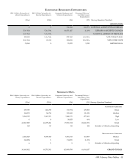
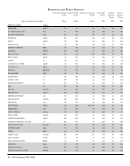
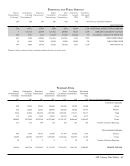
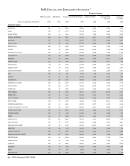
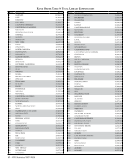
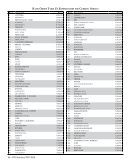
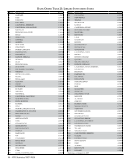
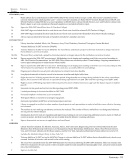
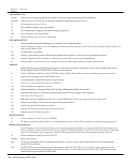
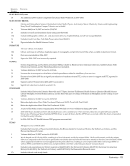
Table 5
Resources per Student in ARL University Libraries, 1986–2008
Median of Ratio Values for Time-Series Trends
Year ILL:
Borrowed
Volumes
Held
Volumes
Added (Gross)
Total
Staff
Monographs
Purchased
(Libraries) (102) (103) (103) (103) (57)
1986 0.42 123.18 4.17 0.0159 2.20
1987 0.44 125.31 3.92 0.0164 1.88
1988 0.44 128.27 3.82 0.0161 1.66
1989 0.50 130.04 3.84 0.0162 1.77
1990 0.55 133.51 3.86 0.0155 1.83
1991 0.63 137.11 4.04 0.0154 1.86
1992 0.62 137.68 3.95 0.0153 1.58
1993 0.68 146.02 3.76 0.0152 1.49
1994 0.74 151.20 4.07 0.0152 1.55
1995 0.80 154.00 4.37 0.0147 1.59
1996 0.89 158.10 3.78 0.0145 1.48
1997 0.89 159.40 4.03 0.0142 1.52
1998 0.97 159.24 4.06 0.0143 1.44
1999 1.05 159.37 4.00 0.0142 1.42
2000 1.13 157.74 3.82 0.0139 1.63
2001 1.16 155.71 3.89 0.0136 1.69
2002 1.14 155.04 3.87 0.0131 1.54
2003 1.14 156.41 3.52 0.0125 1.47
2004 1.20 151.49 3.45 0.0120 1.53
2005 1.22 157.93 3.30 0.0118 1.42
2006 1.22 160.05 3.26 0.0117 1.64
2007 1.13 159.49 3.49 0.0114 1.54
2008 1.19 162.87 3.22 0.0110 1.40
Average annual
%change
4.8% 1.3% -1.2% -1.7% -2.0%
In 2007–2008, ARL libraries acquired 60% fewer monographs per student than purchased in 1986. Libraries reported
fewer staff per student in 2008 as compared to 1986: in 2008, there was a median number of 11 total staff per 1,000 students,
compared to the 1986 figure of 16 per 1,000.