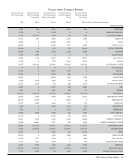
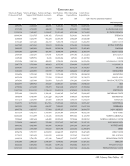
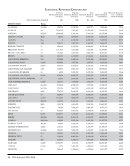
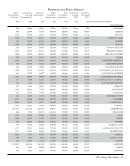
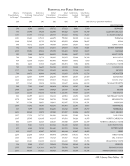
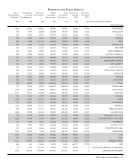
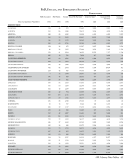
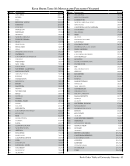
Footnotes · 119
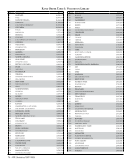
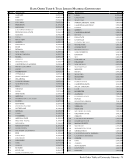
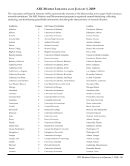
Question
Number
Footnote
HAWAII, cont.
4b Of the total of serials received but not purchased, 7,533 are electronic, but can not be further disaggregated into consortial or freely
accessible. Therefore, the sub-parts of this question have been marked UA/NA.
10 Increase due to cartographic materials returned from processing and receipt of gift materials related to October 2004 flood.
17 Excludes personnel hired with special flood recovery funds: $561,798 for professional and support staff and $52,950 for student
assistants.
17a Includes library faculty and Administrative Technical Professional (APT) personnel categories.
36–37 ARL Statistics 2006–2007 (with combined data for University of Hawaii at Manoa Library, Health Sciences Library, and William S.
Richardson School of Law Library) contained an erroneous number for this item.
38–42 Hawaii’s faculty and student population figures published in the 2006–2007 ARL Statistics for (38)-(42) were incorrect. The correct
numbers are: (38) 1,301 (39) 14,027 (40) 2,190 (41) 3,165 (42) 994.
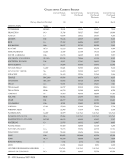
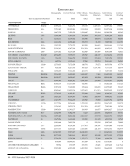
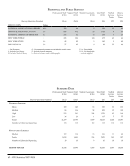
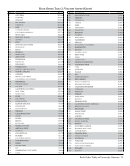
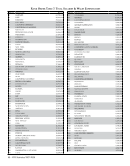
HOUSTON
All figures are as of 08/31/2008.
Library branches included: Architecture &Art Library, Music Library, Weston A. Pettey Optometry Library, and the Pharmacy
Library.
1bi The number of volumes added is smaller for 2007–2008. At the end of this year (2007–2008), available funds were transferred to
purchase more electronic resources.
4 We began using SerialsSolutions during 2007–2008 and feel this has given us a much better count of the number of serials.
4ai This is the number of unique journal titles shown in SerialsSolutions minus consortial titles, minus freely accessible titles.
4aii This number has been de-duped against the electronic titles.
4bi Represents the number of unique titles in our TexShare databases as reported in the SerialsSolutions overlap analysis.
4bii Individual open access titles plus Directory of Open Access Journals titles.
16 Expenditures for binding increased as the library caught up with a binding backlog.
20 The difference between 2006–2007 and 2007–2008 total expenditures is due to a planned carry-over from 2006–2007. In 2007–2008,
funds were expended for compact shelving, furniture and other planned expenses.
22 The library has made a concerted effort to add electronic materials in lieu of print expenditures.
23a Increased expenditures related to addition of SerialsSolutions and other increased costs.
24 Increased expenditures are for hardware and software purchases for our Learning Commons-- a new service offered by the library.
31 The library changed the way it counts reference questions. Previously, staff were asked to count all reference transactions for a
short period of time (one week) and a formula was used to calculate a yearly figure. During 2006–2007, staff began counting every
reference question. This was not done for the entire year, so the numbers that covered the same time period as the previous year’s
sampling were used in the same formula to calculate the figure. There may have been some decrease because all transactions were
not counted.
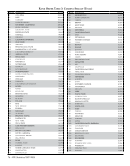
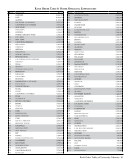
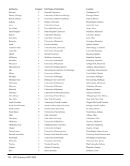
HOWARD
Library branches included: Main Library, Health Sciences Library and Law Library.
1a Volumes held June 30, 2007 revised to 2,435,249.
4 Title count, according to new criteria, including those in aggregated databases, if the title has a record in the library OPAC.
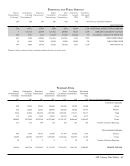
ILLINOIS, CHICAGO
Library branches included: Richard J. Daley Library, Science Library.
3 E-books count (17,222) is bibliographic.
9 Includes statistics for health sciences branches.
16 Figure included in item (19), other operating expenditures.
19 Includes portion of (23), Bibliographic Utilities, Networks and Consortia: OCLC, annual memberships for CIC and CARLI.
23a Does not include OCLC, membership in CARLI or CIC, which are included in (19) (Other Operating Expenditures).
34–35 Figures unavailable for all institutions with which UIC has reciprocal borrowing privileges. I-Share data for health sciences branch
lending are included.
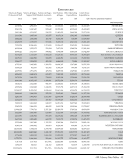
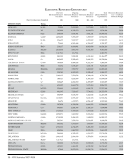
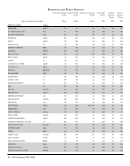
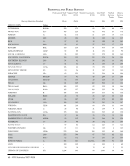
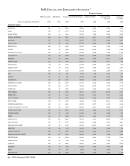
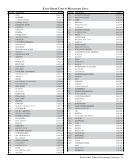
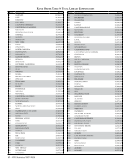
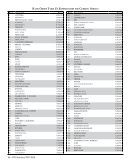
Question
Number
Footnote
HAWAII, cont.
4b Of the total of serials received but not purchased, 7,533 are electronic, but can not be further disaggregated into consortial or freely
accessible. Therefore, the sub-parts of this question have been marked UA/NA.
10 Increase due to cartographic materials returned from processing and receipt of gift materials related to October 2004 flood.
17 Excludes personnel hired with special flood recovery funds: $561,798 for professional and support staff and $52,950 for student
assistants.
17a Includes library faculty and Administrative Technical Professional (APT) personnel categories.
36–37 ARL Statistics 2006–2007 (with combined data for University of Hawaii at Manoa Library, Health Sciences Library, and William S.
Richardson School of Law Library) contained an erroneous number for this item.
38–42 Hawaii’s faculty and student population figures published in the 2006–2007 ARL Statistics for (38)-(42) were incorrect. The correct
numbers are: (38) 1,301 (39) 14,027 (40) 2,190 (41) 3,165 (42) 994.
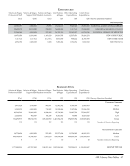
HOUSTON
All figures are as of 08/31/2008.
Library branches included: Architecture &Art Library, Music Library, Weston A. Pettey Optometry Library, and the Pharmacy
Library.
1bi The number of volumes added is smaller for 2007–2008. At the end of this year (2007–2008), available funds were transferred to
purchase more electronic resources.
4 We began using SerialsSolutions during 2007–2008 and feel this has given us a much better count of the number of serials.
4ai This is the number of unique journal titles shown in SerialsSolutions minus consortial titles, minus freely accessible titles.
4aii This number has been de-duped against the electronic titles.
4bi Represents the number of unique titles in our TexShare databases as reported in the SerialsSolutions overlap analysis.
4bii Individual open access titles plus Directory of Open Access Journals titles.
16 Expenditures for binding increased as the library caught up with a binding backlog.
20 The difference between 2006–2007 and 2007–2008 total expenditures is due to a planned carry-over from 2006–2007. In 2007–2008,
funds were expended for compact shelving, furniture and other planned expenses.
22 The library has made a concerted effort to add electronic materials in lieu of print expenditures.
23a Increased expenditures related to addition of SerialsSolutions and other increased costs.
24 Increased expenditures are for hardware and software purchases for our Learning Commons-- a new service offered by the library.
31 The library changed the way it counts reference questions. Previously, staff were asked to count all reference transactions for a
short period of time (one week) and a formula was used to calculate a yearly figure. During 2006–2007, staff began counting every
reference question. This was not done for the entire year, so the numbers that covered the same time period as the previous year’s
sampling were used in the same formula to calculate the figure. There may have been some decrease because all transactions were
not counted.
HOWARD
Library branches included: Main Library, Health Sciences Library and Law Library.
1a Volumes held June 30, 2007 revised to 2,435,249.
4 Title count, according to new criteria, including those in aggregated databases, if the title has a record in the library OPAC.
ILLINOIS, CHICAGO
Library branches included: Richard J. Daley Library, Science Library.
3 E-books count (17,222) is bibliographic.
9 Includes statistics for health sciences branches.
16 Figure included in item (19), other operating expenditures.
19 Includes portion of (23), Bibliographic Utilities, Networks and Consortia: OCLC, annual memberships for CIC and CARLI.
23a Does not include OCLC, membership in CARLI or CIC, which are included in (19) (Other Operating Expenditures).
34–35 Figures unavailable for all institutions with which UIC has reciprocal borrowing privileges. I-Share data for health sciences branch
lending are included.