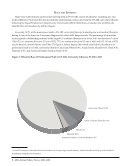
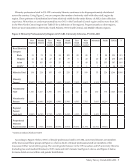
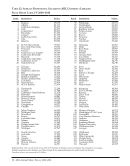
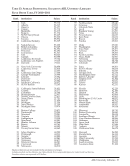
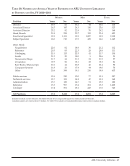
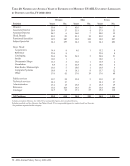
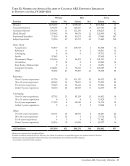
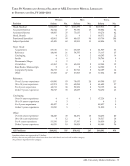
Salary Survey Trends 2010–2011 · 9 Minority professional staff in US ARL university libraries continues to be disproportionately distributed across the country. Using Figure 2, we can compare the number of minority staff with other staff, region by region. These patterns of distribution have been relatively stable for the entire history of ARL’s data-collection experience. Minorities are underrepresented by over 34% in the East South Central region and by more than 28% in the West North Central region (see Table 25 for a definition of the regions). Proportionately to other regions, there are more minorities in the Pacific, South Atlantic, West South Central, and Middle Atlantic regions. Figure 2: Minority Professionals by Region in US ARL University Libraries, FY 2010–2011 New England Middle Atlantic East North Central West North Central South Atlantic East South Central West South Central Mountain Pacific TOTAL %Race/Ethnicity Category Black 31 72 74 24 109 22 28 7 28 395 31% Hispanic 21 44 27 10 39 6 40 20 43 250 20% Asian 79 105 69 25 84 9 40 21 155 587 46% AI/AN* 3 3 15 4 1 0 1 7 0 34 3% Minority Total 134 224 185 63 233 37 109 55 226 1,266 100% Minority Percent 10.60% 17.70% 14.60% 5.00% 18.40% 2.90% 8.60% 4.30% 17.90% Nonminority Total 1,100 1,267 1,390 531 1,216 342 591 430 778 7,645 100% Nonminority Percent 14.40% 16.60% 18.20% 6.90% 15.90% 4.50% 7.70% 5.60% 10.20% Regional Percent Total staff 13.80% 16.70% 17.70% 6.70% 16.30% 4.30% 7.90% 5.40% 11.30% Proportional Minority Representation -26.44% 6.76% -19.63% -28.35% 15.71% -34.67% 11.37% -22.76% 75.42% *American Indian/Alaskan Native According to Figure 3 below, 68.6% of female professional staff in US ARL university libraries are members of the four racial/ethnic groups in Figure 2, whereas 62.4% of female professional staff are members of the Caucasian/Other racial/ethnic group. The overall gender balance in the 115 Canadian and US university libraries (including law and medical libraries) is 35.9% male and 64.1% female. See Figure 2, above, and Figure 3, below, for more detail on race/ethnic and gender distribution.
Help