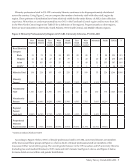
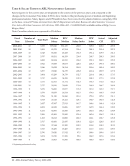
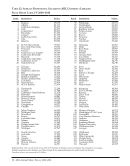
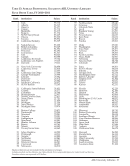
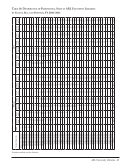
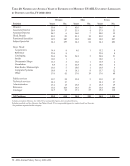
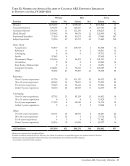
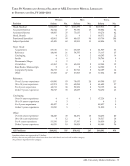
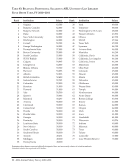
22 · ARL Annual Salary Survey 2010–2011 Table 4: Salary Trends in Canadian ARL University Libraries Salary figures for the current year are displayed in the context of previous years. Canadian salaries are presented in both US $and Canadian $denominations and the annual exchange rate used in the salary surveys is also listed. Canadian salaries are also compared to the changes in the Canadian Consumer Price Index (CPI) to show trends in the purchasing power of median Canadian salaries. CPI number changes are based on July CPI figures. The source for Canadian CPI data is “Table 5: The Consumer Price Index for Canada” published in The Daily, a Statistics Canada publication, available online at http://www.statcan.gc.ca/pub/62-001-x/2011004/t040-eng.htm. Fiscal Year Number of Libraries Total Staff Median Salary in US $† Median Salary Change† Exchange Rate Median Salary in Can. $Median Salary Change Can. CPI** Can. CPI Change* 2010–2011 16 1,112 $77,919 12.7% 1.0556 $82,251 2.0% 116.8 1.8% 2009–2010 15 1,091 69,130 -11.3% 1.1667 80,654 2.4 114.7 -0.9 2008–2009 14 990 77,954 15.8 1.0101 78,742 3.3 115.8 3.4 2007–2008 14 957 67,331 6.7 1.1323 76,239 3.9 112.0 2.2 2006–2007 14 958 63,112 11.8 1.16289 73,392 4.0 109.6 2.3 2005–2006 14 955 56,474 7.1 1.24971 70,576 -0.3 107.1 2.0 2004–2005 14 906 52,707 16.3 1.34328 70,800 3.5 105.0 2.3 2003–2004 14 911 45,310 6.2 1.51023 68,429 2.3 102.6 2.1 2002–2003 14 925 42,657 -0.6 1.56878 66,919 2.6 100.5 2.1 2001–2002 14 861 42,928 -1.1 1.51919 65,215 2.1 98.4 2.7 2000–2001 13 755 43,394 5.0 1.47192 63,873 2.4 95.8 2.9 1999-2000 13 737 41,316 -3.8 1.5103 62,400 2.4 93.1 1.9 1998–1999 13 729 42,963 -2.7 1.4177 60,909 0.9 91.4 1.0 1997–1998 13 732 44,167 1.4 1.3663 60,346 1.7 90.5 1.7 1996–1997 13 764 43,569 0.9 1.3613 59,310 -0.4 89.0 1.3 1995–1996 13 796 43,173 -1.7 1.3794 59,554 1.3 87.9 2.6 1994–1995 13 815 43,919 -6.0 1.3381 58,768 0.7 85.7 0.1 1993–1994 13 816 46,744 -4.3 1.2488 58,374 2.9 85.6 1.7 1992–1993 13 837 48,820 2.7 1.1623 56,744 3.4 84.2 1.2 1991–1992 13 847 47,519 5.5 1.1547 54,870 3.6 83.2 6.0 1990–1991 13 839 45,023 15.1 1.1759 52,942 12.5 78.5 4.1 1989–1990 13 853 39,117 12.3 1.2026 47,042 5.3 75.4 5.3 1988–1989 13 837 34,826 11.7 1.2826 44,668 5.3 71.6 3.9 1987–1988 13 817 31,178 10.9 1.3602 42,408 9.1 68.9 4.6 1986–1987 13 831 28,123 -1.9 1.3817 38,858 1.2 65.9 4.1 1985–1986 13 829 28,666 1.1 1.3388 38,378 7.9 63.3 4.1 1984–1985 12 705 28,346 -0.8 1.2548 35,569 0.8 60.8 4.1 Average 3.8% 3.3% † Includes medical and law libraries. *Canadian CPI change figures have been revised from previous editions based upon changes published by The Daily (Statistics Canada). These changes were caused by rounding they are minute and are less than 0.3 in all cases. **Actual Canadian CPI figures have been added to this table (not available in previous editions).
Help