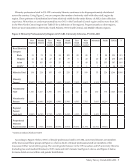
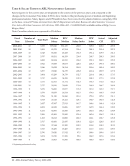
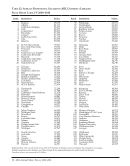
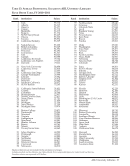
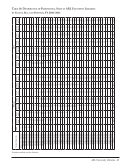
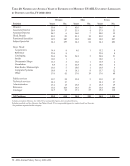
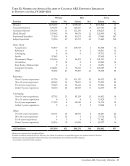
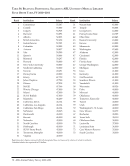
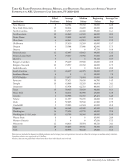
62 · ARL Annual Salary Survey 2010–2011 Table 31: Filled Positions Average, Median, and Beginning Professional Salaries and Average Years of Professional Experience in Canadian ARL University Libraries, FY 2010–2011 Filled Positions Average Salaries Median Salaries Beginning Salaries Average Yrs. Exp. Institution FY 2011 FY 2010 FY 2011 FY 2010 FY 2011 FY 2010 FY 2011 FY 2011 Alberta ‡ 72 $98,203 $101,564 $104,209 $102,139 $50,632 $55,770 15.7 British Columbia ‡ 72 85,196 89,757 81,675 87,753 55,335 55,335 17.7 Calgary ‡ 53 94,823 96,879 89,543 93,666 58,000 58,000 18.7 Guelph ‡ 50 80,634 85,069 78,054 81,146 59,699 61,639 18.1 Laval 65 72,293 71,189 72,888 73,833 49,547 49,547 13.1 McGill 64 74,432 75,422 67,475 68,471 50,000 50,000 15.7 McMaster ‡ 45 71,878 72,880 72,928 65,572 46,817 48,500 17.6 Manitoba ‡ 40 95,500 96,777 100,070 100,644 48,820 48,820 22.9 Montreal ‡ 89 73,199 74,421 69,243 69,243 43,130 45,915 15.3 Ottawa ‡* 34 N/A 92,217 N/A 89,855 N/A 50,181 18.9 Queen’s 32 93,924 101,504 97,348 104,510 51,600 53,251 21.3 Saskatchewan ‡ 46 89,027 89,895 91,994 86,118 52,731 55,104 16.0 Toronto ‡ 141 91,249 90,332 87,729 86,827 51,900 52,200 15.6 Waterloo ‡ 36 81,938 80,906 81,972 80,198 51,804 51,840 17.4 Western Ontario ‡ 65 68,921 72,394 65,014 70,684 47,380 50,496 13.4 York ‡ 53 96,016 105,317 90,210 101,808 49,000 49,000 17.6 Salaries are expressed in Canadian dollars. Excludes Canadian medical and law libraries. See Tables 35 and 42 for comparable figures for medical and law libraries. Directors are included in figures for average years of experience and filled positions, but not in either the average or median salary statistics. ‡ See Footnotes. *Ottawa became a member in 2010.
Help