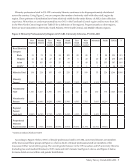
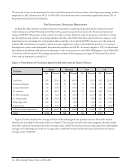
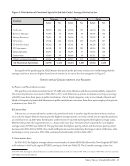
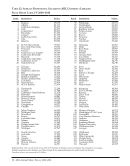
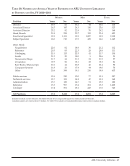
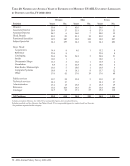
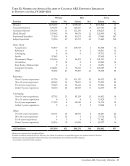
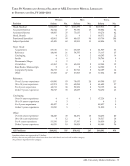
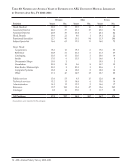
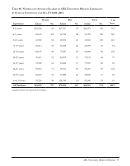
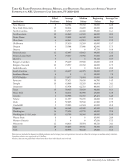
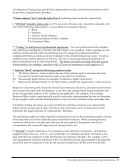
Salary Survey Trends 2010–2011 · 13 Figure 5: Distribution of Functional Specialist Job Sub-Codes’ Average Salaries by Sex Position Women Men Total Salary No. Salary No. Salary No. Archivists 58,579 304 62,798 172 60,103 476 Business Manager 71,545 94 69,483 54 70,793 148 Human Resources 73,821 70 76,836 13 74,293 83 IT, Systems 67,504 134 67,104 263 67,239 397 IT, Web Developer 63,210 65 65,032 88 64,258 153 IT, Programmer 66,506 91 69,418 203 68,516 294 Media Specialist 56,837 51 56,495 57 56,656 108 Preservation 63,646 89 66,466 40 64,521 129 Other Functional Specialists 63,264 233 64,515 117 63,682 350 All Functional Specialists 64,990 1,131 66,461 1,007 65,562 2,138 In regards to the gender gap in ARL libraries discussed in the previous section, it is worth noting that the average salaries of men are higher than those of women in six out of the nine categories in Figure 5. Institutional Characteristics and Salaries A. Public and Private Institutions The gap between salaries paid in private US ARL university libraries and those paid in publicly supported US university libraries increased in 2010–2011 to 7.1%, with librarians at private institutions earning an average of $4,921 more than their peers at public institutions. Out of 18 job categories, only in two (Head of Serials and Head of Computer Systems) did librarians in public institutions earn more than their peers employed in private institutions (see Table 21). B. Library Size Library size, as measured by the number of professional staff, is another significant determinant of salary. As a rule, the largest libraries tend to pay the highest average salaries, not only overall, but for specific positions, as well. However, in 2010–2011, the libraries with between 75 and 110 staff reported the highest average salary, $74,158, followed by the largest libraries, i.e., those with more than 110 staff, which reported the next highest average salary, $73,863 (see Table 23). The gap between the highest paying cohort and the lowest paying cohort decreased in 2010–2011 to $3,994. The cutoff staffing levels used to determine the largest cohort of libraries, after declining in every year since 1995–1996, continued to hold steady at 110 in 2010–2011.4 C. Geographic Area In 2010–2011, the highest average salaries were found in Canada ($83,424) followed by New England ($77,452) with salaries in the Pacific region ($75,823) coming in third (see Table 25). The Canadian average salary has 4 In 1995–1996, the largest cohort of libraries was determined based on staff over 124 in 1996–1998, over 120 in 1998-1999, over 115 and since 1999–2000, over 110. See Table 23.
Help