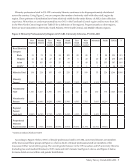
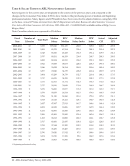
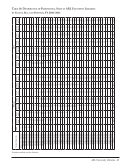
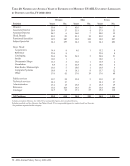
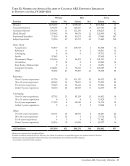
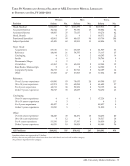
Salary Levels for Staff in ARL Libraries · 21 Table 3: Salary Trends in US ARL University Libraries Salary figures for the current year are displayed in the context of previous years and compared to the changes in the US Consumer Price Index (CPI) to show trends in the purchasing power of median and beginning professional salaries. Salary figures and CPI numbers have been converted to adjusted indexes, using July 1984 as the base. Actual CPI data retrieved from the US Department of Labor, Bureau of Labor Statistics’ Consumer Price Index-All Urban Consumers (US All items, 1982–1984=100 -CUUR0000SA0) available online at http://www. bls.gov/data/. Fiscal Year Number of Libraries Total Staff Median Salary† Median Salary Change Median Salary Index Actual CPI* Adjusted CPI CPI Change 2010–2011 99 8,925 $65,000 1.5% 250.5 218.0 209.8 1.2% 2009–2010 99 9,116 64,069 0.6 246.9 215.4 207.3 -2.0 2008–2009 99 9,158 63,673 3.8 245.4 219.9 211.6 5.6 2007–2008 99 9,026 61,329 3.5 236.4 208.3 200.5 2.4 2006–2007 99 8,866 59,280 3.7 228.5 203.5 195.9 4.1 2005–2006 99 8,700 57,173 2.8 220.4 195.4 188.1 3.2 2004–2005 99 8,581 55,600 3.2 214.3 189.4 182.3 3.0 2003–2004 100 8,581 53,859 2.0 207.6 183.9 177.0 2.1 2002–2003 100 8,544 52,789 1.9 203.5 180.1 173.3 1.5 2001–2002 99 8,337 51,806 4.1 199.7 177.5 170.8 2.7 2000–2001 99 8,127 49,753 3.7 191.8 172.8 166.3 3.7 1999-2000 98 7,858 48,000 4.1 185.0 166.7 160.4 2.1 1998–1999 97 7,671 46,130 3.6 177.8 163.2 157.1 1.7 1997–1998 97 7,682 44,544 3.4 171.7 160.5 154.5 2.2 1996–1997 96 7,562 43,084 3.4 166.1 157.0 151.1 3.0 1995–1996 95 7,435 41,651 2.7 160.5 152.5 146.8 2.8 1994–1995 95 7,401 40,573 3.4 156.4 148.4 142.8 2.8 1993–1994 95 7,390 39,257 3.0 151.3 144.4 139.0 2.8 1992–1993 95 7,375 38,124 3.0 146.9 140.5 134.9 3.2 1991–1992 94 7,408 37,009 3.5 142.6 136.2 131.1 4.4 1990–1991 94 7,543 35,761 5.2 137.8 130.4 125.8 4.8 1989–1990 94 7,344 34,000 5.8 131.0 124.4 119.3 5.0 1988–1989 94 7,252 32,149 5.4 123.9 118.5 113.9 4.1 1987–1988 93 7,145 30,492 5.1 117.5 113.8 109.3 3.9 1986–1987 92 6,886 29,021 6.5 111.9 109.5 105.5 1.6 1985–1986 91 6,707 27,249 5.0 105.0 107.8 103.6 3.6 1984–1985 91 6,456 25,946 6.9 100.0 104.1 100.0 -*Actual CPI figures have been revised from previous editions based upon changes published by the Bureau of Labor Statistics. These changes are minute, less than 0.3 in all cases. † Includes medical and law libraries.
Help