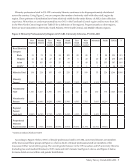
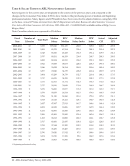
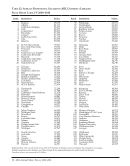
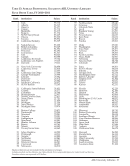
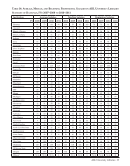
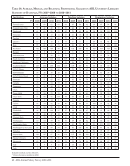
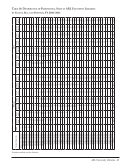
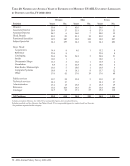
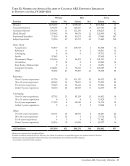
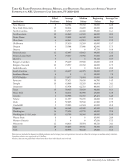
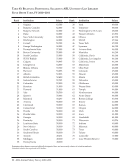
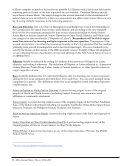
Salary Intervals Num ber of Staff Percent at each level † Dir. Assoc. Dir. Asst. Dir. Branch Head Subj. Spec. Func. Spec. Dept. Head Other Prof. Dir. Assoc. Dir. Asst. Dir. Branch Head Subj. Spec. Func. Spec. Dept. Head Other Prof. More than 300,000 6 5% 250,000–299,999 9 8% 200,000–250,000 32 3 1 1 29% 1% 1% 0% 175,000–199,999 28 8 3 2 25% 2% 2% 0% 150,000–174,999 27 16 9 1 2 2 2 25% 5% 5% 0% 0% 0% 0% 140,000–149,999 6 27 2 8 1 8 1 5% 8% 1% 2% 0% 1% 0% 130,000–139,999 41 10 4 6 1 8 5 13% 6% 1% 0% 0% 1% 0% 120,000–129,999 1 50 20 12 8 2 21 9 1% 15% 12% 3% 0% 0% 2% 0% 110,000–119,999 59 21 16 23 22 46 18 18% 13% 4% 1% 2% 3% 1% 100,000–109,999 62 34 33 40 29 81 52 19% 20% 7% 2% 3% 6% 2% 95,000–99,999 1 10 20 27 41 35 78 55 1% 3% 12% 6% 2% 3% 6% 2% 90,000–94,999 15 9 29 56 29 84 36 5% 5% 6% 3% 3% 6% 1% 85,000–89,999 11 12 34 89 39 130 64 3% 7% 8% 4% 3% 10% 2% 80,000–84,999 12 8 43 114 69 149 94 4% 5% 10% 5% 6% 11% 4% 79,000–79,999 2 11 31 12 26 24 1% 2% 1% 1% 2% 1% 78,000–78,999 2 2 11 27 15 26 17 1% 1% 2% 1% 1% 2% 1% 76,000–77,999 1 2 18 55 31 57 54 0% 1% 4% 3% 3% 4% 2% 74,000–75,999 2 1 23 63 45 59 70 1% 1% 5% 3% 4% 4% 3% 72,000–73,999 2 29 74 44 50 82 1% 6% 3% 4% 4% 3% 70,000–71,999 1 18 67 50 51 86 1% 4% 3% 4% 4% 3% 68,000–69,999 1 22 90 58 54 105 0% 5% 4% 5% 4% 4% 66,000–67,999 3 18 84 49 48 98 2% 4% 4% 4% 4% 4% 64,000–65,999 1 1 16 118 62 50 138 0% 1% 4% 6% 5% 4% 5% 62,000–63,999 1 2 19 85 57 49 103 0% 1% 4% 4% 5% 4% 4% 60,000–61,999 6 125 62 44 162 1% 6% 5% 3% 6% 58,000–59,999 1 1 9 97 55 38 144 0% 1% 2% 5% 5% 3% 5% 56,000–57,999 2 10 96 54 36 170 1% 2% 4% 5% 3% 6% 54,000–55,999 6 102 62 18 171 1% 5% 5% 1% 6% 52,000–53,999 1 8 119 58 33 173 1% 2% 6% 5% 2% 7% 50,000–51,999 5 104 45 22 157 1% 5% 4% 2% 6% 48,000–49,999 7 101 53 13 132 2% 5% 5% 1% 5% 46,000–47,999 2 101 56 12 119 0% 5% 5% 1% 4% 44,000–45,999 4 64 18 12 117 1% 3% 2% 1% 4% 42,000–43,999 1 1 58 24 14 69 1% 0% 3% 2% 1% 3% 40,000–41,999 39 8 10 56 2% 1% 1% 2% 38,000–39,999 1 23 1 2 25 0% 1% 0% 0% 1% 36,000–37,999 15 1 1 19 1% 0% 0% 1% 34,000–35,999 11 2 12 1% 0% 0% less than 34,000 9 3 2 10 0% 0% 0% 0% Total 110 325 168 452 2138 1149 1338 2649 100% 100% 100% 100% 100% 100% 100% 100% 42 · ARL Annual Salary Survey 2010–2011 Table 15: Distribution of Professional Staff in ARL University Libraries by Salary and Position, FY 2010–2011 Excludes medical and law libraries. † A “0” percentage indicates less than one-half of one percent.
Help