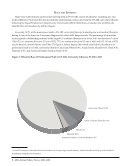
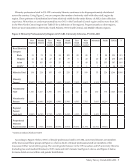
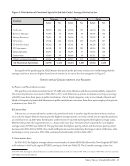
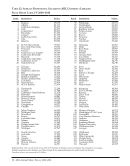
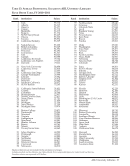
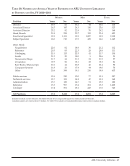
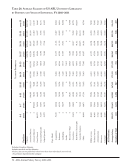
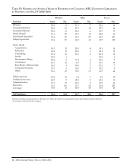
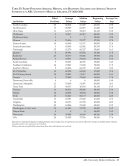
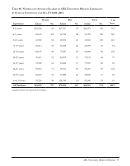
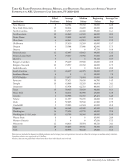
12 · ARL Annual Salary Survey 2010–2011 The scarcity of men in the profession has been well documented in many studies—the largest percentage of men employed in ARL libraries was 38.2% in 1980–1981 since then men have consistently represented about 35% of the professional staff in ARL libraries. The Functional Specialist Breakdown In 2004, the ARL Statistics and Measurement Committee accepted a proposal from the ACRL Personnel Administrators and Staff Development Officers Discussion Group to break down the Functional Specialist category (FSPEC). The group’s major concern was that so many different types of positions, with their varying job descriptions and salaries, were being labeled with the code FSPEC that data reported for the category were beginning to lose meaning. For each position that would have been labeled FSPEC in past years, the proposal offered ARL institutions two options: either use one of eight new codes to describe that position or, if none of the eight new codes could adequately describe that position, use FSPEC. As seen in Figure 4, 17.3% of Functional Specialists in all libraries did not use an alternative code, an increase over the 2009–2010 figures. As in 2009–2010, Archivists and Information Technology specialists comprised the largest percentage of Functional Specialists who used an alternative code (61.5%). Figure 4: Distribution of Functional Specialist Job Sub-Codes by Type of Library Position Main Medical Law All No. Percent No. Percent No. Percent No. Percent Archivists 476 22.3% 20 10.9% 6 11.1% 502 21.1% Business Manager 148 6.9% 17 9.2% 2 3.7% 167 7.0% Human Resources 83 3.9% 1 0.5% 0 0.0% 84 3.5% IT, Systems 397 18.6% 44 23.9% 13 24.1% 454 19.1% IT, Web Developer 153 7.2% 18 9.8% 9 16.7% 180 7.6% IT, Programmer 294 13.8% 32 17.4% 0 0.0% 326 13.7% Media Specialist 108 5.1% 7 3.8% 4 7.4% 116 4.9% Preservation 129 6.0% 3 1.6% 1 1.9% 133 5.6% Other Functional Specialists 350 16.4% 42 22.8% 19 35.2% 411 17.3% Total 2,138 184 54 2,376 Figure 5, below, displays the average salaries of the subcategories by position and sex (law and medical libraries not included) in the same fashion as Table 17. The salaries in each of the sub-categories deviate widely from the combined Functional Specialist average salary of $65,562. Human resource specialists have the highest average of all subcategories, with an average salary of $74,293 media/multimedia specialists have the lowest average salary of $56,656.
Help