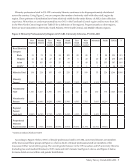
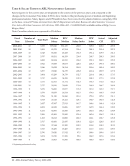
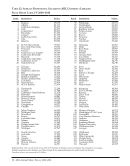
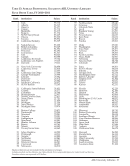
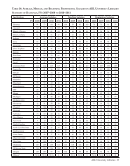
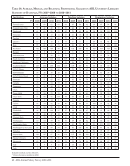
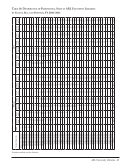
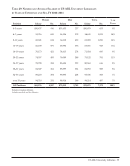
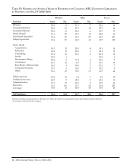
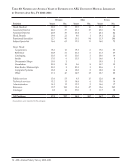
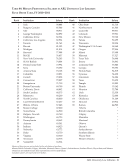
Salary Levels for Staff in ARL Libraries · 19 Table 1: Distribution by Salary Level Figures in columns headed by fiscal year show the number of filled professional positions. Columns headed by Cum. %show the percentage of all filled positions with salaries equal to or more than the beginning of each salary range. Note: Canadian salaries are expressed in US dollars. Data includes medical and law libraries. University Libraries Nonuniversity Libraries FY Cum. FY Cum. FY Cum. FY Cum. Salary Range 2009–2010 %2010–2011 %2009–2010 %2010–2011 %300,000 and above 6 0.1% 6 0.1% 0 0.0% 0 0.0% 250,000–299,999 12 0.2% 11 0.2% 1 0.0% 0 0.0% 200,000–250,000 37 0.5% 42 0.6% 3 0.1% 3 0.1% 175,000–199,999 58 1.1% 56 1.1% 6 0.3% 7 0.3% 150,000–174,999 80 1.9% 87 2.0% 284 7.7% 315 8.8% 140,000–149,999 52 2.4% 70 2.7% 105 10.5% 116 11.9% 130,000–139,999 80 3.2% 99 3.7% 237 16.7% 218 17.8% 120,000–129,999 127 4.4% 141 5.1% 170 21.1% 252 24.6% 110,000–119,999 193 6.3% 253 7.6% 370 30.9% 331 33.5% 100,000–109,999 328 9.5% 402 11.6% 383 40.9% 422 44.9% 95,000–99,999 287 12.3% 304 14.7% 301 48.8% 205 50.4% 90,000–94,999 337 15.6% 312 17.8% 144 52.6% 210 56.1% 85,000–89,999 418 19.7% 452 22.3% 276 59.8% 206 61.6% 80,000–84,999 546 25.1% 575 28.0% 201 65.1% 241 68.1% 79,000–79,999 121 26.3% 122 29.2% 48 66.4% 63 69.8% 78,000–78,999 143 27.7% 118 30.4% 48 67.6% 5 69.9% 76,000–77,999 261 30.2% 258 33.0% 49 68.9% 66 71.7% 74,000–75,999 321 33.4% 320 36.1% 89 71.2% 115 74.8% 72,000–73,999 285 36.2% 338 39.5% 123 74.5% 56 76.3% 70,000–71,999 323 39.3% 351 43.0% 29 75.2% 83 78.6% 68,000–69,999 400 43.3% 387 46.9% 97 77.8% 94 81.1% 66,000–67,999 370 46.9% 374 50.6% 89 80.1% 79 83.2% 64,000–65,999 451 51.3% 480 55.4% 89 82.4% 49 84.6% 62,000–63,999 400 55.2% 377 59.1% 114 85.4% 178 89.4% 60,000–61,999 530 60.4% 495 64.1% 93 87.9% 47 90.6% 58,000–59,999 430 64.6% 408 68.1% 46 89.1% 54 92.1% 56,000–57,999 487 69.4% 457 72.7% 120 92.2% 61 93.7% 54,000–55,999 459 73.9% 422 76.9% 44 93.4% 48 95.0% 52,000–53,999 496 78.7% 476 81.6% 84 95.6% 45 96.2% 50,000–51,999 439 83.1% 397 85.6% 87 97.9% 75 98.2% 48,000–49,999 446 87.4% 353 89.1% 13 98.2% 10 98.5% 46,000–47,999 368 91.0% 330 92.4% 16 98.6% 7 98.7% 44,000–45,999 326 94.2% 263 95.0% 11 98.9% 8 98.9% 42,000–43,999 217 96.3% 200 97.0% 14 99.3% 33 99.8% 40,000–41,999 175 98.1% 134 98.3% 17 99.7% 0 99.8% 38,000–39,999 85 98.9% 67 99.0% 0 99.7% 1 99.8% 36,000–37,999 52 99.4% 39 99.4% 2 99.8% 2 99.9% 34,000–35,999 38 99.8% 25 99.6% 3 99.9% 2 99.9% less than 34,000 23 100.0% 36 100.0% 5 100.0% 2 100.0% Total Positions 10,207 10,037 3,748 3,709 Median Salary $64,560 $66,260 $80,320 $95,020
Help