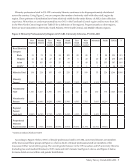
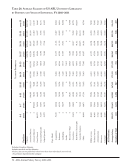
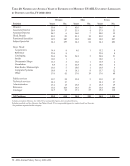
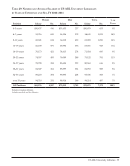
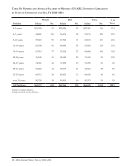
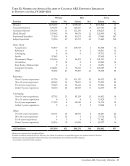
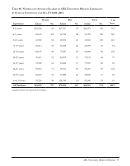
14 · ARL Annual Salary Survey 2010–2011 not been this high since 2008–2009 when it was $82,295. This sharp increase in Canadian salaries is due to fluctuations in the currency exchange rate. For the 2010–2011 survey period the Canadian currency exchange rate is 1.0556. The East South Central region had the lowest average salary: $62,842. D. Rank Structure Rank structure provides a useful framework for examining professional salaries in ARL university libraries. Figure 6, below, displays average salary and years of experience in the most commonly used rank structures. Readers should be aware that not all individuals have a rank that fits into the rank structure the library utilizes. Most commonly, directors may have no rank (or a rank outside the structure) and it is common for non-librarians included in the survey (business officers, personnel staff, computer specialists, liaisons, etc.) to be unranked, as well. The pattern of relationships between rank and salary seen in past years continues: with higher rank associated with higher average years of experience and a correspondingly higher salary. 5,722 of the 8,329 librarians in ARL university member libraries occupy a rank within these three most commonly found ranking systems, and the largest number of professionals (3,183) occupy a position in a four-step rank structure. Figure 6: Average Salaries and Average Years of Experience of Library Professionals in Libraries with Three, Four, and Five Step Rank Structures, FY 2010–2011 Three-Step Four-Step Five-Step Salary Experience Salary Experience Salary Experience Librarian 1 59,888 9.2 53,813 7.9 53,176 7.7 Librarian 2 69,935 17.6 60,214 13.1 59,922 13.0 Librarian 3 87,641 25.4 72,896 20.4 68,968 17.5 Librarian 4 88,116 26.3 87,744 23.6 Librarian 5 103,069 29.1 No. of Staff 1,475 3,183 1,064 Inflation Effect Tables 2 and 6 reveal changes in beginning professional and median salaries as reported by both university and nonuniversity research libraries as well as the US Bureau of Labor’s Cost of Living Index (CPI-All Urban Consumers). Table 3 is similar to Table 2, but reports data only on US libraries. Table 4 shows trend data for Canadian libraries and compares them to the changes in the Canadian Consumer Price Index (Consumer Price Index for Canada, all-items, not seasonally adjusted). Tables 2, 3, and 4 include law and medical library staff in ARL university libraries. In contrast to 2009–2010, these tables indicate that the purchasing power of professionals (in both the United States and Canada) employed in ARL libraries kept pace with inflation. The median salary for US ARL university libraries in 2010 increased to $65,000 (see Table 3). This modest salary increase barely kept pace with the rebounding economy, which saw the US CPI increase by 1.2% (see Table 3).5 Likewise, Canadian salaries (reported in Canadian dollars) also barely surpassed inflation: the Canadian CPI 5 CPI data retrieved from the US Department of Labor, Bureau of Labor Statistics’ Consumer Price Index-All Urban Consumers (US All items, 1982-84=100 -CUUR0000SA0) available online at http://www.bls.gov/data/.
Help