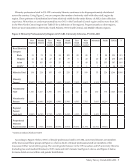
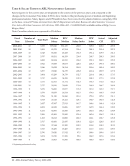
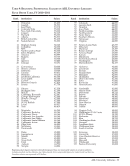
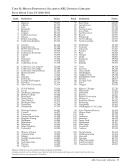
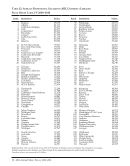
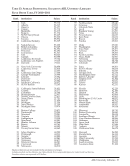
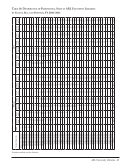
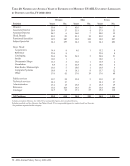
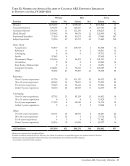
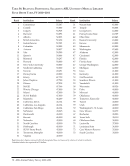
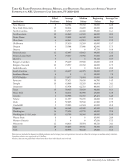
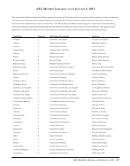
30 · ARL Annual Salary Survey 2010–2011 Table 7: Filled Positions Average, Median, and Beginning Salaries and Average Years of Experience in ARL University Libraries, FY 2010–2011 Filled Positions Average Salaries Median Salaries Beginning Salaries Average Yrs. Exp. Institution FY 2011 FY 2010 FY 2011 FY 2010 FY 2011 FY 2010 FY 2011 FY 2011 Rice 59 62,215 65,202 55,833 60,300 37,200 38,700 15.4 Rochester ‡ 67 55,837 59,814 53,000 56,059 38,168 38,983 16.4 Rutgers ‡ 86 89,058 91,176 91,751 91,751 49,286 50,765 22.5 Saskatchewan † ‡ 46 76,307 85,160 78,850 81,582 45,197 52,202 16.0 South Carolina ‡ 48 53,658 52,032 49,838 48,627 34,000 38,000 16.9 Southern California ‡ 105 74,479 76,057 67,650 69,761 48,500 48,500 19.6 Southern Illinois 36 58,264 59,157 52,536 56,912 44,000 44,000 14.9 SUNY Albany ‡ 62 60,964 64,024 58,822 62,729 39,000 39,350 17.3 SUNY Buffalo ‡ 72 72,916 75,265 69,048 70,554 45,000 47,000 19.9 SUNY Stony Brook ‡ 24 79,837 87,447 75,457 79,599 42,000 43,000 22.3 Syracuse ‡ 54 65,847 67,893 60,648 61,390 None 38,000 19.3 Temple ‡ 39 66,849 69,082 58,140 60,048 44,044 44,004 19.7 Tennessee ‡ 40 69,380 68,677 66,307 67,268 44,000 44,000 18.9 Texas ‡ 121 66,882 66,964 59,260 59,304 46,000 45,000 17.1 Texas A&M ‡ 113 62,441 64,966 55,704 59,055 47,500 48,500 15.0 Texas Tech ‡ 68 60,690 58,352 57,135 54,163 45,000 45,000 12.6 Toronto † 141 78,211 85,574 75,194 82,254 44,484 49,451 15.6 Tulane 35 60,534 62,835 56,325 59,492 40,000 40,000 17.9 Utah 58 61,470 61,061 56,312 55,375 44,000 45,000 19.2 Vanderbilt ‡ 62 58,991 59,927 54,655 55,945 40,500 41,000 18.0 Virginia ‡ 72 67,988 70,351 60,000 64,600 44,000 44,000 17.7 Virginia Tech ‡ 38 63,148 63,308 58,540 58,540 40,000 40,000 16.8 Washington ‡ 115 66,476 65,466 59,934 58,752 42,600 42,600 19.2 Washington State ‡ 42 62,755 63,512 58,172 58,172 38,500 38,500 19.6 Washington U.-St. Louis ‡ 62 59,037 60,832 53,740 55,489 40,000 40,000 17.2 Waterloo † ‡ 36 70,230 76,645 70,260 75,974 44,402 49,110 17.4 Wayne State ‡ 73 61,261 60,697 54,705 55,396 40,500 41,000 13.4 Western Ontario † ‡ 65 59,073 68,581 55,725 66,961 40,610 47,836 13.4 Wisconsin ‡ 155 61,856 61,068 58,654 57,692 40,526 40,526 18.1 Yale ‡ 191 81,088 80,642 76,300 76,365 50,500 50,500 19.0 York † ‡ 53 82,297 99,770 77,321 96,446 41,999 46,419 17.6 Excludes medical and law libraries. See Tables 35 and 42 for comparable figures for medical and law libraries. Directors are included in figures for average years of experience and filled positions, but not in either the average or median salary statistics. † Canadian salaries are expressed in US dollars. ‡ See Footnotes. *Ottawa became a member in 2010 and was included for the first time in the ARL Annual Salary Survey 2010–2011.
Help