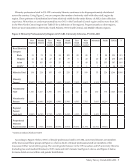
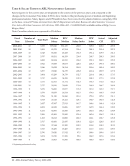
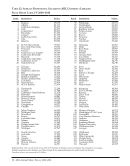
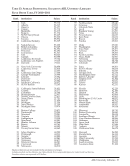
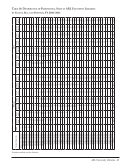
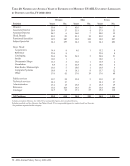
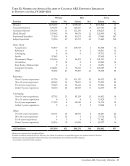
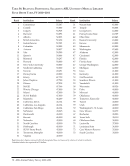
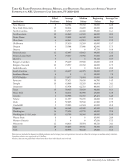
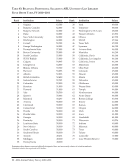
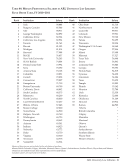
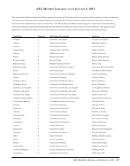
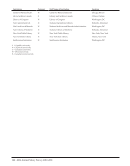
ARL University Law Libraries · 79 Table 42: Filled Positions Average, Median, and Beginning Salaries and Average Years of Experience in ARL University Law Libraries, FY 2010–2011 Institution Filled Positions Average Salary Median Salary Beginning Salary Average Yrs. Exp. New Mexico 8 64,782 59,760 50,000 12.8 New York University 19 80,014 76,203 60,000 22.6 North Carolina 12 74,737 68,000 55,000 16.1 Northwestern 10 65,860 61,503 44,000 22.3 Notre Dame 14 70,802 66,500 44,000 18.1 Ohio State 6 68,061 61,510 46,000 12.5 Oklahoma 7 57,410 51,269 45,000 15.7 Oregon 6 53,544 57,846 42,000 17.5 Ottawa 4 ‡ ‡ 47,538 18.8 Pennsylvania 12 67,497 65,462 49,000 13.3 Pennsylvania State 9 79,637 73,992 57,000 23.0 Queen’s 3 ‡ ‡ 50,446 10.7 Rutgers, Camden 8 75,469 87,500 62,000 22.8 Rutgers, Newark 10 73,957 65,760 62,000 17.5 Saskatchewan 3 ‡ ‡ 52,202 23.0 South Carolina 11 65,437 68,375 50,000 12.7 Southern Illinois 4 ‡ ‡ 50,000 7.0 SUNY Buffalo 11 74,077 74,004 55,000 14.0 Syracuse 10 57,621 54,630 46,700 14.5 Temple 10 63,848 53,203 44,004 24.1 Tennessee 7 65,954 62,718 48,000 15.7 Texas 15 59,425 53,429 40,000 16.1 Texas Tech 8 60,612 56,990 47,000 12.8 Toronto 6 83,988 81,765 49,451 14.8 Tulane 6 61,297 59,455 40,000 19.3 Utah 8 57,095 52,530 41,500 17.5 Vanderbilt 5 70,083 61,524 41,000 21.0 Virginia 14 68,562 63,500 63,500 16.1 Washington 16 72,458 65,735 60,000 22.8 Washington U.-St. Louis 10 63,709 58,560 48,000 19.9 Wayne State 4 ‡ ‡ 45,000 24.0 Western Ontario 3 ‡ ‡ 47,836 15.3 Wisconsin 12 64,416 58,954 40,526 24.1 Yale 18 85,403 85,911 50,500 20.1 York 5 87,978 90,448 49,000 16.2 Directors are included in figures for filled positions and average years of experience, but not in either the average or median salary statistics. Canadian salaries are expressed in US dollars. ‡ Salary data are not published when fewer than four individuals are involved.
Help