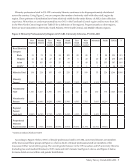
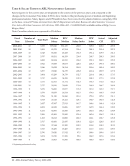
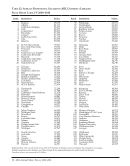
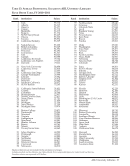
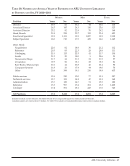
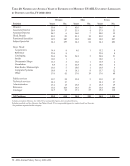
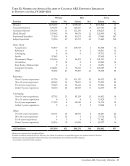
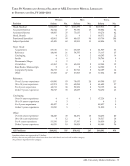
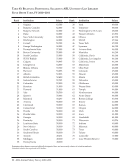
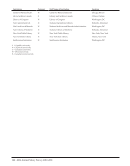
20 · ARL Annual Salary Survey 2010–2011 Table 2: Salary Trends in ARL University Libraries Salary figures for the current year are displayed in the context of previous years and compared to the changes in the US Consumer Price Index (CPI) to show trends in the purchasing power of median and beginning professional salaries. Salary figures and CPI numbers have been converted to adjusted indexes, using July 1984 as the base. Actual CPI data retrieved from the US Department of Labor, Bureau of Labor Statistics’ Consumer Price Index-All Urban Consumers (US All items, 1982–1984=100 -CUUR0000SA0) available online at http://www. bls.gov/data/. Note: Canadian salaries are expressed in US dollars. Fiscal Year Number of Libraries Total Staff Median Salary† BPS‡ Median Median Salary Index BPS‡ Index Actual CPI* Adjusted CPI 2010–2011 115 10,037 $66,260 $44,004 253.9 266.7 218.0 209.8 2009–2010 114 10,207 64,560 43,700 247.4 264.8 215.4 207.3 2008–2009 113 10,148 64,823 44,000 248.4 266.7 219.9 211.6 2007–2008 113 9,983 61,833 41,125 236.9 249.7 208.3 200.5 2006–2007 113 9,824 59,648 40,000 228.5 242.4 203.5 195.9 2005–2006 113 9,655 57,074 37,920 218.7 229.8 195.4 188.1 2004–2005 113 9,487 55,250 36,984 211.7 224.1 189.4 182.3 2003–2004 114 9,492 53,000 36,000 203.1 218.2 183.9 177.0 2002–2003 114 9,469 51,636 35,000 197.8 212.1 180.1 173.3 2001–2002 113 9,198 50,724 34,000 194.3 206.1 177.5 170.8 2000–2001 112 8,882 49,068 32,879 188.0 199.3 172.8 166.3 1999-2000 111 8,595 47,377 31,100 181.5 188.5 166.7 160.4 1998–1999 110 8,400 45,775 30,000 175.2 181.7 163.2 157.1 1997–1998 110 8,414 44,534 28,500 170.5 172.6 160.5 154.5 1996–1997 109 8,325 43,170 27,687 165.3 167.7 157.0 151.1 1995–1996 108 8,231 41,901 27,000 160.5 163.6 152.5 146.8 1994–1995 108 8,216 41,088 26,000 157.4 157.6 148.4 142.8 1993–1994 108 8,132 40,225 25,834 154.1 156.6 144.4 139.0 1992–1993 108 8,212 39,265 25,000 150.4 151.5 140.5 134.9 1991–1992 107 8,256 38,537 24,000 147.7 145.5 136.2 131.1 1990–1991 107 8,382 36,701 23,800 140.6 144.2 130.4 125.8 1989–1990 107 8,253 34,629 22,000 132.7 133.3 124.4 119.3 1988–1989 107 8,087 32,461 20,400 124.4 123.6 118.5 113.9 1987–1988 106 7,962 30,534 19,460 117.0 117.9 113.8 109.3 1986–1987 105 7,718 28,941 18,250 110.9 110.6 109.5 105.5 1985–1986 105 7,543 27,485 17,500 105.3 106.1 107.8 103.6 1984–1985 104 7,161 26,100 16,500 100.0 100.0 104.1 100.0 *Actual CPI figures have been revised from previous editions based upon changes published by the Bureau of Labor Statistics. These changes are minute, less than 0.3 in all cases. † Includes medical and law libraries. ‡ Beginning professional salary.
Help