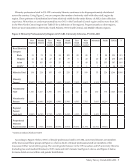
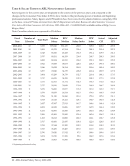
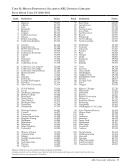
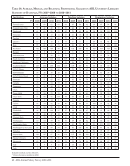
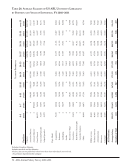
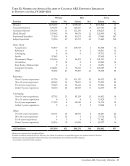
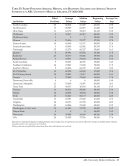
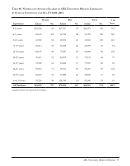
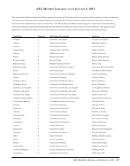
US ARL University Libraries · 59 Table 29: Number and Average Salaries of US ARL University Librarians by Years of Experience and Sex, FY 2010–2011 Women Men Total %of Total Position Salary No. Salary No. Salary No. 0–3 years $50,437 416 $51,655 237 $50,879 653 9% 4–7 years 53,716 659 56,196 372 54,611 1,031 14% 8–11 years 60,601 634 64,110 422 62,003 1,056 14% 12–15 years 66,239 571 69,796 376 67,651 947 13% 16–19 years 70,173 421 74,615 274 71,924 695 9% 20–23 years 74,557 493 76,089 288 75,122 781 11% 24–27 years 78,798 394 83,694 222 80,563 616 8% 28–31 years 84,307 364 85,557 224 84,783 588 8% 32–35 years 89,270 304 99,893 204 93,536 508 7% over 35 years 94,710 331 98,914 166 96,114 497 7% All Positions $69,576 4,587 $73,015 2,785 $70,875 7,372 100% Excludes Canadian libraries. Excludes medical and law libraries.
Help