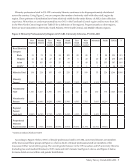
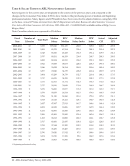
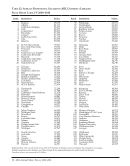
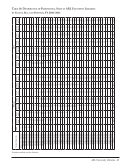
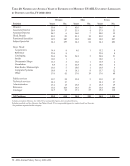
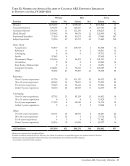
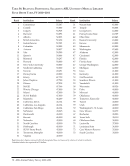
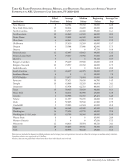
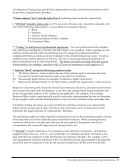
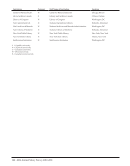
46 · ARL Annual Salary Survey 2010–2011 Table 19: Number and Average Salaries of ARL University Librarians by Years of Experience and Sex, FY 2010–2011 Women Men Total %of Total Position Salary No. Salary No. Salary No. 0–3 years $52,119 510 $53,359 281 $52,559 791 9% 4–7 years 55,553 754 57,412 408 56,206 1,162 14% 8–11 years 62,306 725 65,184 467 63,433 1,192 14% 12–15 years 67,850 632 70,634 405 68,937 1,037 12% 16–19 years 71,752 473 75,951 302 73,388 775 9% 20–23 years 76,649 560 77,362 319 76,908 879 11% 24–27 years 80,829 442 85,297 257 82,472 699 8% 28–31 years 86,385 416 87,248 245 86,705 661 8% 32–35 years 90,264 347 100,108 222 94,105 569 7% over 35 years 96,923 379 100,671 185 98,153 564 7% All Positions $71,230 5,238 $74,159 3,091 $72,317 8,329 100% Excludes medical and law libraries. See Tables 41 and 48 for comparable figures for medical and law libraries. Canadian salaries are expressed in US dollars. See Table 34 for salaries of Canadian librarians expressed in Canadian dollars.
Help