Data Tables 2010–2011 · 37
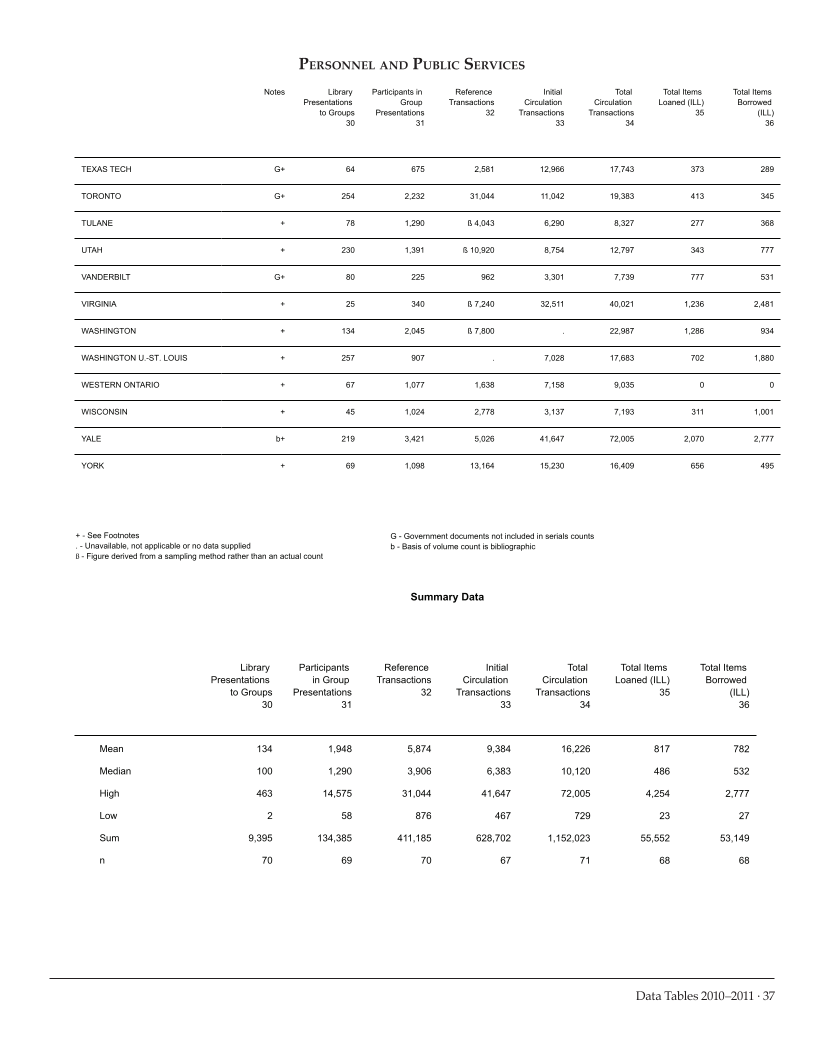
Personnel and Public Services
Notes Library
Presentations
to Groups
30
Participants in
Group
Presentations
31
Reference
Transactions
32
Initial
Circulation
Transactions
33
Total
Circulation
Transactions
34
Total Items
Loaned (ILL)
35
Total Items
Borrowed
(ILL)
36
TEXAS TECH G+ 64 675 2,581 12,966 17,743 373 289
TORONTO G+ 254 2,232 31,044 11,042 19,383 413 345
TULANE +78 1,290 ß 4,043 6,290 8,327 277 368
UTAH +230 1,391 ß 10,920 8,754 12,797 343 777
VANDERBILT G+ 80 225 962 3,301 7,739 777 531
VIRGINIA +25 340 ß 7,240 32,511 40,021 1,236 2,481
WASHINGTON +134 2,045 ß 7,800 .22,987 1,286 934
WASHINGTON U.-ST. LOUIS +257 907 .7,028 17,683 702 1,880
WESTERN ONTARIO +67 1,077 1,638 7,158 9,035 0 0
WISCONSIN +45 1,024 2,778 3,137 7,193 311 1,001
YALE b+ 219 3,421 5,026 41,647 72,005 2,070 2,777
YORK +69 1,098 13,164 15,230 16,409 656 495
+-See Footnotes
.-Unavailable, not applicable or no data supplied
ß -Figure derived from a sampling method rather than an actual count
G -Government documents not included in serials counts
b -Basis of volume count is bibliographic
Summary Data
Library
Presentations
to Groups
30
Participants
in Group
Presentations
31
Reference
Transactions
32
Initial
Circulation
Transactions
33
Total
Circulation
Transactions
34
Total Items
Loaned (ILL)
35
Total Items
Borrowed
(ILL)
36
U Mean
Median
High
Low
Sum
n
134
100
463
2
9,395
70
1,948
1,290
14,575
58
134,385
69
5,874
3,906
31,044
876
411,185
70
9,384
6,383
41,647
467
628,702
67
16,226
10,120
72,005
729
1,152,023
71
817
486
4,254
23
55,552
68
782
532
2,777
27
53,149
68


