Data Tables 2010–2011 · 13
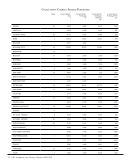
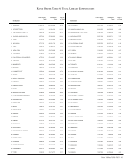
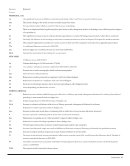
Collections: Current Serials Purchased
Notes Current Serials
Total
5
Current Serials
Purchased
5a
Current Serials
Purchased
Electronic
5a.i
Current Serials
Purchased Print
5a.ii
TEXAS TECH G+ 6,195 5,340 4,515 825
TORONTO G+ 1,753 1,730 46 1,684
TULANE +7,519 7,470 5,153 2,317
UTAH +4,605 4,515 494 4,021
VANDERBILT G+ 2,102 2,102 56 2,046
VIRGINIA +39,088 37,348 34,359 2,989
WASHINGTON +3,670 2,960 2,500 460
WASHINGTON U.-ST. LOUIS +12,310 8,886 7,075 1,811
WESTERN ONTARIO +1,331 1,210 42 1,168
WISCONSIN +....
YALE b+ 34,773 34,647 32,078 2,569
YORK +6,761 6,426 5,550 876
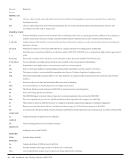
+-See Footnotes
.-Unavailable, not applicable or no data supplied
G -Government documents not included in serials counts
b -Basis of volume count is bibliographic
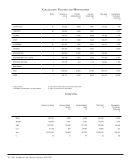
Summary Data
Current Serials Total
5
Current Serials
Purchased
5a
Current Serials
Purchased Electronic
5a.i
Current Serials
Purchased Print
5a.ii
U Mean
Median
High
Low
Sum
n
9,943
6,478
49,027
1,098
656,212
66
9,256
5,798
46,912
1,076
610,892
66
7,222
3,631
45,725
42
440,532
61
2,540
1,904
10,895
274
162,530
64
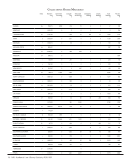
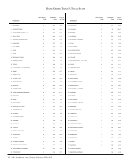
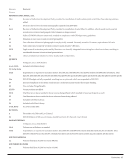
Collections: Current Serials Purchased
Notes Current Serials
Total
5
Current Serials
Purchased
5a
Current Serials
Purchased
Electronic
5a.i
Current Serials
Purchased Print
5a.ii
TEXAS TECH G+ 6,195 5,340 4,515 825
TORONTO G+ 1,753 1,730 46 1,684
TULANE +7,519 7,470 5,153 2,317
UTAH +4,605 4,515 494 4,021
VANDERBILT G+ 2,102 2,102 56 2,046
VIRGINIA +39,088 37,348 34,359 2,989
WASHINGTON +3,670 2,960 2,500 460
WASHINGTON U.-ST. LOUIS +12,310 8,886 7,075 1,811
WESTERN ONTARIO +1,331 1,210 42 1,168
WISCONSIN +....
YALE b+ 34,773 34,647 32,078 2,569
YORK +6,761 6,426 5,550 876
+-See Footnotes
.-Unavailable, not applicable or no data supplied
G -Government documents not included in serials counts
b -Basis of volume count is bibliographic
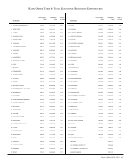
Summary Data
Current Serials Total
5
Current Serials
Purchased
5a
Current Serials
Purchased Electronic
5a.i
Current Serials
Purchased Print
5a.ii
U Mean
Median
High
Low
Sum
n
9,943
6,478
49,027
1,098
656,212
66
9,256
5,798
46,912
1,076
610,892
66
7,222
3,631
45,725
42
440,532
61
2,540
1,904
10,895
274
162,530
64