28 · ARL Academic Law Library Statistics 2010–2011
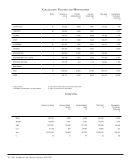
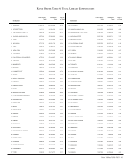
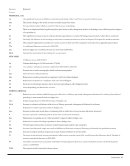
Electronic Resources Expenditures
Notes One-time
Electronic
Resource
Purchases
22
Ongoing
Electronic
Resource
Purchases
23
Total
Electronic
Resource
Purchases
22 +23
Total Library
Materials
Expenditures
16
Electronic
Resources as
a %of Library
Materials
Budget
TEXAS TECH G+ 2,612 160,233 162,845 1,058,021 15.39
TORONTO G+ 34,718 186,546 221,264 1,087,372 20.35
TULANE +0 400,195 400,195 1,090,106 36.71
UTAH +404 108,062 108,466 687,265 15.78
VANDERBILT G+ 138,410 429,962 568,372 1,615,807 35.18
VIRGINIA +45,000 297,591 342,591 1,427,546 24.00
WASHINGTON +0 207,267 207,267 1,134,685 18.27
WASHINGTON U.-ST. LOUIS +102,237 372,086 474,323 1,160,476 40.87
WESTERN ONTARIO +0 80,364 80,364 1,044,455 7.69
WISCONSIN +29,655 320,442 350,097 1,235,846 28.33
YALE b+ .511,262 511,262 2,583,915 19.79
YORK +81,917 180,575 262,493 644,105 40.75
+-See Footnotes
.-Unavailable, not applicable or no data supplied
G -Government documents not included in serials counts
b -Basis of volume count is bibliographic
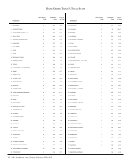
Summary Data
One-time
Electronic
Resource
Purchases
22
Ongoing
Electronic
Resource
Purchases
23
Total Electronic
Resource
Purchases
22 +23
Total Library
Materials
Expenditures
16
U Mean
Median
High
Low
Totals
Number of Libraries Reporting
71,377
65,276
401,725
40
3,283,335
46
316,942
296,415
750,934
80,364
22,185,942
70
363,847
332,577
756,411
80,364
25,469,277
70
1,347,156
1,134,291
3,507,074
399,565
99,689,567
74
Electronic
Resources as a
%of Library
Materials
Budget
30.02
27.63
73.04
7.69
70
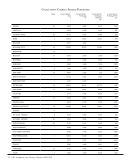
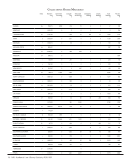
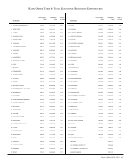
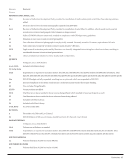
Electronic Resources Expenditures
Notes One-time
Electronic
Resource
Purchases
22
Ongoing
Electronic
Resource
Purchases
23
Total
Electronic
Resource
Purchases
22 +23
Total Library
Materials
Expenditures
16
Electronic
Resources as
a %of Library
Materials
Budget
TEXAS TECH G+ 2,612 160,233 162,845 1,058,021 15.39
TORONTO G+ 34,718 186,546 221,264 1,087,372 20.35
TULANE +0 400,195 400,195 1,090,106 36.71
UTAH +404 108,062 108,466 687,265 15.78
VANDERBILT G+ 138,410 429,962 568,372 1,615,807 35.18
VIRGINIA +45,000 297,591 342,591 1,427,546 24.00
WASHINGTON +0 207,267 207,267 1,134,685 18.27
WASHINGTON U.-ST. LOUIS +102,237 372,086 474,323 1,160,476 40.87
WESTERN ONTARIO +0 80,364 80,364 1,044,455 7.69
WISCONSIN +29,655 320,442 350,097 1,235,846 28.33
YALE b+ .511,262 511,262 2,583,915 19.79
YORK +81,917 180,575 262,493 644,105 40.75
+-See Footnotes
.-Unavailable, not applicable or no data supplied
G -Government documents not included in serials counts
b -Basis of volume count is bibliographic
Summary Data
One-time
Electronic
Resource
Purchases
22
Ongoing
Electronic
Resource
Purchases
23
Total Electronic
Resource
Purchases
22 +23
Total Library
Materials
Expenditures
16
U Mean
Median
High
Low
Totals
Number of Libraries Reporting
71,377
65,276
401,725
40
3,283,335
46
316,942
296,415
750,934
80,364
22,185,942
70
363,847
332,577
756,411
80,364
25,469,277
70
1,347,156
1,134,291
3,507,074
399,565
99,689,567
74
Electronic
Resources as a
%of Library
Materials
Budget
30.02
27.63
73.04
7.69
70