Data Tables 2010–2011 · 31
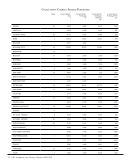
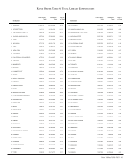
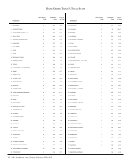
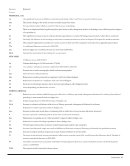
Electronic Resources Expenditures
Notes Bibl. Utilities,
Networks, etc.
Library
Expenditures
24a
Bibl. Utilities,
Networks, etc.
External
Expenditures
24b
Computer
Hardware and
Software
Expenditures
25
Document Delivery
/Interlibrary Loan
Expenditures
26
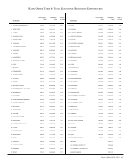
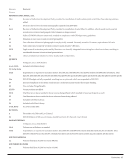
TEXAS TECH G+ 13,502 0 237,014 994
TORONTO G+ ..72,989 0
TULANE +50,022 0 3,166 3,141
UTAH +25,406 0 0 734
VANDERBILT G+ 19,990 0 406 0
VIRGINIA +20,000 1,999 43,460 12,534
WASHINGTON +54,843 0 1,513 1,549
WASHINGTON U.-ST. LOUIS +35,406 0 26,770 6,227
WESTERN ONTARIO +.0 ..
WISCONSIN +10,000 0 19,509 1,406
YALE b+ 80,500 .41,583 3,213
YORK +9,167 .38,979 1,182
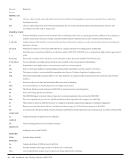
+-See Footnotes
.-Unavailable, not applicable or no data supplied
G -Government documents not included in serials counts
b -Basis of volume count is bibliographic
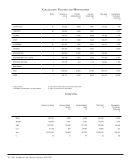
Summary Data
Bibl. Utilities,
Networks, etc. Library
Expenditures
24a
Bibl. Utilities,
Networks, etc.
External Expenditures
24b
Computer Hardware
and Software
Expenditures
25
Document Delivery /
Interlibrary Loan
Expenditures
26
U Mean
Median
High
Low
Sum
n
36,941
18,820
358,984
4,730
2,031,736
55
18,410
9,510
94,145
523
220,917
12
41,176
18,515
305,794
166
2,305,853
56
4,564
1,438
37,490
15
250,993
55
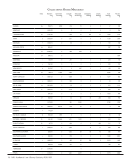
Electronic Resources Expenditures
Notes Bibl. Utilities,
Networks, etc.
Library
Expenditures
24a
Bibl. Utilities,
Networks, etc.
External
Expenditures
24b
Computer
Hardware and
Software
Expenditures
25
Document Delivery
/Interlibrary Loan
Expenditures
26
TEXAS TECH G+ 13,502 0 237,014 994
TORONTO G+ ..72,989 0
TULANE +50,022 0 3,166 3,141
UTAH +25,406 0 0 734
VANDERBILT G+ 19,990 0 406 0
VIRGINIA +20,000 1,999 43,460 12,534
WASHINGTON +54,843 0 1,513 1,549
WASHINGTON U.-ST. LOUIS +35,406 0 26,770 6,227
WESTERN ONTARIO +.0 ..
WISCONSIN +10,000 0 19,509 1,406
YALE b+ 80,500 .41,583 3,213
YORK +9,167 .38,979 1,182
+-See Footnotes
.-Unavailable, not applicable or no data supplied
G -Government documents not included in serials counts
b -Basis of volume count is bibliographic
Summary Data
Bibl. Utilities,
Networks, etc. Library
Expenditures
24a
Bibl. Utilities,
Networks, etc.
External Expenditures
24b
Computer Hardware
and Software
Expenditures
25
Document Delivery /
Interlibrary Loan
Expenditures
26
U Mean
Median
High
Low
Sum
n
36,941
18,820
358,984
4,730
2,031,736
55
18,410
9,510
94,145
523
220,917
12
41,176
18,515
305,794
166
2,305,853
56
4,564
1,438
37,490
15
250,993
55