Data Tables 2010–2011 · 19
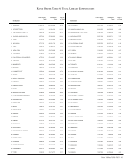
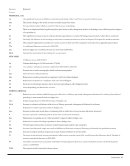
Collections: Other Materials
Notes Microform
Units
7
Government
Documents
8
Computer
Files
9
Manuscripts
and Archives
10
Cartographic
Materials
11
Graphic
Materials
12
Audio
Materials
13
Film and
Video
14
TEXAS TECH G+ 696,939 0 419 0 0 0 228 1,281
TORONTO G+ 58,823 .235 0 0 34 117 243
TULANE +1,247,656 0 823 1,206 0 588 539 529
UTAH +630,851 0 867 0 0 0 868 356
VANDERBILT G+ 757,763 0 0 50 1 0 160 316
VIRGINIA +1,287,830 4,807 183 2,895 533 2,836 108 2,053
WASHINGTON +1,100,031 0 0 0 0 0 0 0
WASHINGTON U.-ST. LOUIS +1,481,896 .940 ...499 688
WESTERN ONTARIO +59,910 0 0 0 0 0 0 0
WISCONSIN +975,830 0 920 16 0 0 449 899
YALE b+ 321,732 .....217 1,962
YORK +138,868 .6,905 ....306
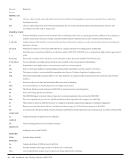
+-See Footnotes
.-Unavailable, not applicable or no data supplied
G -Government documents not included in serials counts
b -Basis of volume count is bibliographic
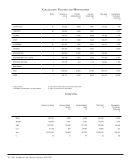
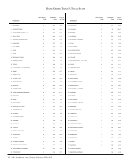
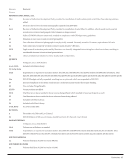
Summary Data
Microform
Units
7
Government
Documents
8
Computer
Files
9
Manuscripts
and Archives
10
Cartographic
Materials
11
Graphic
Materials
12
Audio
Materials
13
Film and
Video
14
U Mean
Median
High
Low
Sum
n
999,555
975,830
2,649,248
19,770
70,968,381
71
109,411
12,191
937,909
890
1,750,572
16
903
655
6,905
5
51,499
57
719
193
4,345
3
25,148
35
302
9
3,505
1
6,944
23
939
41
11,160
1
18,773
20
706
443
5,705
2
45,169
64
854
644
3,701
6
57,234
67
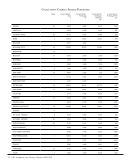
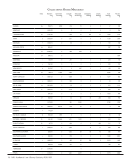
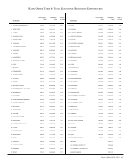
Collections: Other Materials
Notes Microform
Units
7
Government
Documents
8
Computer
Files
9
Manuscripts
and Archives
10
Cartographic
Materials
11
Graphic
Materials
12
Audio
Materials
13
Film and
Video
14
TEXAS TECH G+ 696,939 0 419 0 0 0 228 1,281
TORONTO G+ 58,823 .235 0 0 34 117 243
TULANE +1,247,656 0 823 1,206 0 588 539 529
UTAH +630,851 0 867 0 0 0 868 356
VANDERBILT G+ 757,763 0 0 50 1 0 160 316
VIRGINIA +1,287,830 4,807 183 2,895 533 2,836 108 2,053
WASHINGTON +1,100,031 0 0 0 0 0 0 0
WASHINGTON U.-ST. LOUIS +1,481,896 .940 ...499 688
WESTERN ONTARIO +59,910 0 0 0 0 0 0 0
WISCONSIN +975,830 0 920 16 0 0 449 899
YALE b+ 321,732 .....217 1,962
YORK +138,868 .6,905 ....306
+-See Footnotes
.-Unavailable, not applicable or no data supplied
G -Government documents not included in serials counts
b -Basis of volume count is bibliographic
Summary Data
Microform
Units
7
Government
Documents
8
Computer
Files
9
Manuscripts
and Archives
10
Cartographic
Materials
11
Graphic
Materials
12
Audio
Materials
13
Film and
Video
14
U Mean
Median
High
Low
Sum
n
999,555
975,830
2,649,248
19,770
70,968,381
71
109,411
12,191
937,909
890
1,750,572
16
903
655
6,905
5
51,499
57
719
193
4,345
3
25,148
35
302
9
3,505
1
6,944
23
939
41
11,160
1
18,773
20
706
443
5,705
2
45,169
64
854
644
3,701
6
57,234
67