Footnotes · 99
Question
Number
Footnote
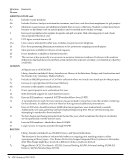
MARYLAND cont.
12 FY12 figure (613,152) reported to ARL was incorrect. The first two digits of a portion of the figure (422,931
vs 242,931) were transposed, creating a difference of 180,000. The correct FY12 figure is 433,152.
17 Short-term loans like equipment were excluded. Equipment loans were 63,134.
19 Increase may be due to the higher visibility of our database resources through WorldCat.
20 FY12 erroneously listed as 20,336,697. We are not sure where this mistake was made, but it looks like
the question number (20) got added to the front of the figure. Should have been 336,697. For FY13, some
database vendors did not provide us with federated search counts.
21 Decrease primarily due to short-staffing. Did not supply requests via OCLC during April.
22 Decrease due to canceling expired requests and providing more items through expanded within-campus
document delivery service.
26–29 In FY12, we reported the Fall 2012 enrollment figures instead of Fall 2011. I’m not sure how far back we’ve
done that. Since the FY13 figures are supposed to include Fall 2012 enrollment, we’re reporting the same
figures as last time. So there will be no change in our enrollment figures from FY12 to FY13, but we will
be back on track.
MASSACHUSETTS
Library branches included: Science and Engineering Library, Image Collection Library.
11 The library only paid $218,893, or, 1.82% of salaries for state funded positions which covers fringes not
available to state employees in general (e.g., dental health coverage). The state pays for fringe benefits for
all state-funded positions from an appropriation which is outside the university budget, and because
fringes vary among various classes of state employees (e.g., firefighters, police, etc.), there is not an official
rate paid for university staff. In FY13 the library paid 27.8 percent of salaries for fringe benefits to four
staff members (other than student employees) in non-state funded positions. The total amount paid by
university and state funds for all staff is approximately $2,151,893.
15 Attendance data not collected.
MIT
Library branches included: All libraries at MIT are included in the ARL statistics. This includes all special
collections as well.
2 A change in method for determining volume count using a bibliographic count rather than our historic,
physical count resulted in a total that is 22% lower than the previous year.
6 As in past years, this total figure and all dollar figures include funds from all sources: general, endowed,
gifts, and sponsored.
7.c Collection support includes contract binding, contract cataloguing, and document delivery.
21 Growth in number of filled requests provided to other libraries is due to increased lending transactions
among Borrow Direct partners.
MIAMI
All figures are as of 05/31/2013.
Library branches included: Business, Architecture, Music Library data are included in the Richter
(Central) Library statistics.
Richter (Central), Marine, Law, and Calder Medical Library data are included in the total ARL statistics
for the University of Miami Libraries.
1,2, 4,
18–22
Included with Central Library. [Marine Library]
Question
Number
Footnote
MARYLAND cont.
12 FY12 figure (613,152) reported to ARL was incorrect. The first two digits of a portion of the figure (422,931
vs 242,931) were transposed, creating a difference of 180,000. The correct FY12 figure is 433,152.
17 Short-term loans like equipment were excluded. Equipment loans were 63,134.
19 Increase may be due to the higher visibility of our database resources through WorldCat.
20 FY12 erroneously listed as 20,336,697. We are not sure where this mistake was made, but it looks like
the question number (20) got added to the front of the figure. Should have been 336,697. For FY13, some
database vendors did not provide us with federated search counts.
21 Decrease primarily due to short-staffing. Did not supply requests via OCLC during April.
22 Decrease due to canceling expired requests and providing more items through expanded within-campus
document delivery service.
26–29 In FY12, we reported the Fall 2012 enrollment figures instead of Fall 2011. I’m not sure how far back we’ve
done that. Since the FY13 figures are supposed to include Fall 2012 enrollment, we’re reporting the same
figures as last time. So there will be no change in our enrollment figures from FY12 to FY13, but we will
be back on track.
MASSACHUSETTS
Library branches included: Science and Engineering Library, Image Collection Library.
11 The library only paid $218,893, or, 1.82% of salaries for state funded positions which covers fringes not
available to state employees in general (e.g., dental health coverage). The state pays for fringe benefits for
all state-funded positions from an appropriation which is outside the university budget, and because
fringes vary among various classes of state employees (e.g., firefighters, police, etc.), there is not an official
rate paid for university staff. In FY13 the library paid 27.8 percent of salaries for fringe benefits to four
staff members (other than student employees) in non-state funded positions. The total amount paid by
university and state funds for all staff is approximately $2,151,893.
15 Attendance data not collected.
MIT
Library branches included: All libraries at MIT are included in the ARL statistics. This includes all special
collections as well.
2 A change in method for determining volume count using a bibliographic count rather than our historic,
physical count resulted in a total that is 22% lower than the previous year.
6 As in past years, this total figure and all dollar figures include funds from all sources: general, endowed,
gifts, and sponsored.
7.c Collection support includes contract binding, contract cataloguing, and document delivery.
21 Growth in number of filled requests provided to other libraries is due to increased lending transactions
among Borrow Direct partners.
MIAMI
All figures are as of 05/31/2013.
Library branches included: Business, Architecture, Music Library data are included in the Richter
(Central) Library statistics.
Richter (Central), Marine, Law, and Calder Medical Library data are included in the total ARL statistics
for the University of Miami Libraries.
1,2, 4,
18–22
Included with Central Library. [Marine Library]