Footnotes · 111
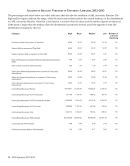
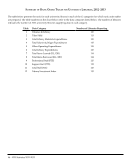
Question
Number
Footnote
PURDUE cont.
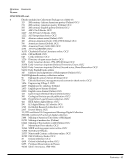
2 Volumes held June 30, 2013, includes cataloged government documents. Includes e-books: Credo
Reference (635), EEBO (78,323), ECCO (136,003), EngNet Base (1678), Gale Virtual Reference (814), ACLS
Humanities (3510), 18th Century Collections Online (136,003), Knovel (3427), Springer (34,756), Safari
(1093), Stat Ref (10), Alexander Street Press (2578), ACS (1323), Begell House (12), Brill (2187), Cambridge
(271), ChemLibNetBase (859), EBSCO (3342), eHRAF (255), Elsevier (3577), Evans (37,370), IEEE (625), IGI
Global (1183), Lyell Geological (368), Oxford Ref (228), RSC (1192), Sabin (46,293), Sage (14), SIAM (387),
SourceOECD (5348), Synthesis Digital (488), Wiley (9842), World Scientific (481), Foundations and Trends
(218), and others.
6 Increase of 9.2% is due to hiring of additional faculty and increase in materials costs.
8 Prior to FY12 fringe benefits were included.
8.a Increase of 10.8% is due to addition of five new faculty and salary equity adjustments for some existing
faculty.
10 Types of benefits included in rate: Health/Medical, Group Life Insurance, Retirement, SS, LTD, Worker’s
Compensation, Unemployment, Liability &Fidelity and Staff Tuition Fee Remission
24 The 21.3% decrease is due to a calculation error for FY12. The number last year should have been 63 also.
QUEEN’S
All figures are as of 04/30/2013.
For the first time, this survey now includes ALL library locations including Health Sciences, Law, and
Special Collections in ALL questions answered.
6–9, 10,
12
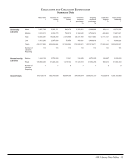
Expenditures as reported in Canadian dollars—Collections Expenditures: (7a) $1,572,691 (7b) $7,897,877
(7c) $748,062 (7) $10,218,630 Salary Expenditures: (8a) $3,842,282 (8b) $3,923,098 (8c) $306,291 (8)
$8,071,671 (10) $1,951,716 Overall Expenditures: (7) $10,218,630 (8) $8,071,671 (9) $957,223 (6) $19,247,524
(12) NA/UA. NOTE: Total Salaries and Wages (Q8) EXCLUDES Fringe Benefits Expenditures (Q10).
18–19 Queen’s University is currently in the process of changing the way we collect statistics, so are unable to
provide a complete picture of our usage this year. This number comes from SUSHI harvested COUNTER
Journal Report 1 statistics gathered from 28,794 journals. Most major journals in our collection are
represented in this number, but it does not include numbers for journals that we are unable to harvest
COUNTER reports from via SUSHI or those for which we are still setting up access.
18 There are a total of 112,700 journals activated in our ERM.
19 There are a total of 1399 databases activated in our ERM.
20 This is the number of searches performed in Serials Solutions Summon, which Queen’s University
licenses as our discovery layer
23–29 As of November 2012.
RICE
Library branches included: Fondren Library, Business Information Center.
2 Includes 24,273 Texshare e-books, government document e-books 11,695 Netlibrary and other e-books
and 7,769 ETDs.
7.a Normal rebalancing of one-time vs. ongoing materials expenditures.
7.b Includes commercial binding ($62,597).
8.a Created/filled several new positions.
8.c Decrease due to cut in funds available for student workers and hiring more work/study students.
10 FY12 figure in error should have been $1,525,927.
11 FY12 percentage in error should have been 28.3% for staff. Student percentage is 1.5%.
Question
Number
Footnote
PURDUE cont.
2 Volumes held June 30, 2013, includes cataloged government documents. Includes e-books: Credo
Reference (635), EEBO (78,323), ECCO (136,003), EngNet Base (1678), Gale Virtual Reference (814), ACLS
Humanities (3510), 18th Century Collections Online (136,003), Knovel (3427), Springer (34,756), Safari
(1093), Stat Ref (10), Alexander Street Press (2578), ACS (1323), Begell House (12), Brill (2187), Cambridge
(271), ChemLibNetBase (859), EBSCO (3342), eHRAF (255), Elsevier (3577), Evans (37,370), IEEE (625), IGI
Global (1183), Lyell Geological (368), Oxford Ref (228), RSC (1192), Sabin (46,293), Sage (14), SIAM (387),
SourceOECD (5348), Synthesis Digital (488), Wiley (9842), World Scientific (481), Foundations and Trends
(218), and others.
6 Increase of 9.2% is due to hiring of additional faculty and increase in materials costs.
8 Prior to FY12 fringe benefits were included.
8.a Increase of 10.8% is due to addition of five new faculty and salary equity adjustments for some existing
faculty.
10 Types of benefits included in rate: Health/Medical, Group Life Insurance, Retirement, SS, LTD, Worker’s
Compensation, Unemployment, Liability &Fidelity and Staff Tuition Fee Remission
24 The 21.3% decrease is due to a calculation error for FY12. The number last year should have been 63 also.
QUEEN’S
All figures are as of 04/30/2013.
For the first time, this survey now includes ALL library locations including Health Sciences, Law, and
Special Collections in ALL questions answered.
6–9, 10,
12
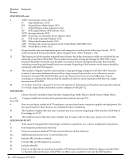
Expenditures as reported in Canadian dollars—Collections Expenditures: (7a) $1,572,691 (7b) $7,897,877
(7c) $748,062 (7) $10,218,630 Salary Expenditures: (8a) $3,842,282 (8b) $3,923,098 (8c) $306,291 (8)
$8,071,671 (10) $1,951,716 Overall Expenditures: (7) $10,218,630 (8) $8,071,671 (9) $957,223 (6) $19,247,524
(12) NA/UA. NOTE: Total Salaries and Wages (Q8) EXCLUDES Fringe Benefits Expenditures (Q10).
18–19 Queen’s University is currently in the process of changing the way we collect statistics, so are unable to
provide a complete picture of our usage this year. This number comes from SUSHI harvested COUNTER
Journal Report 1 statistics gathered from 28,794 journals. Most major journals in our collection are
represented in this number, but it does not include numbers for journals that we are unable to harvest
COUNTER reports from via SUSHI or those for which we are still setting up access.
18 There are a total of 112,700 journals activated in our ERM.
19 There are a total of 1399 databases activated in our ERM.
20 This is the number of searches performed in Serials Solutions Summon, which Queen’s University
licenses as our discovery layer
23–29 As of November 2012.
RICE
Library branches included: Fondren Library, Business Information Center.
2 Includes 24,273 Texshare e-books, government document e-books 11,695 Netlibrary and other e-books
and 7,769 ETDs.
7.a Normal rebalancing of one-time vs. ongoing materials expenditures.
7.b Includes commercial binding ($62,597).
8.a Created/filled several new positions.
8.c Decrease due to cut in funds available for student workers and hiring more work/study students.
10 FY12 figure in error should have been $1,525,927.
11 FY12 percentage in error should have been 28.3% for staff. Student percentage is 1.5%.