
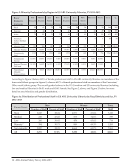
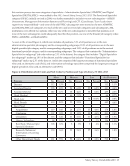
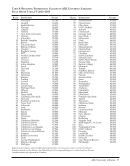
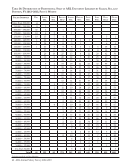
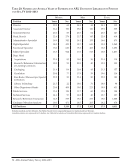
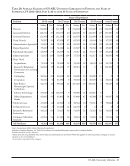
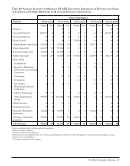
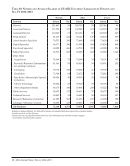
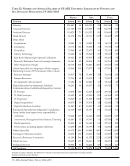
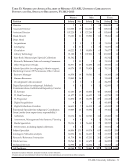
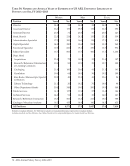
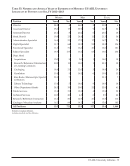
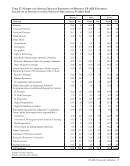
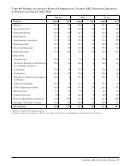
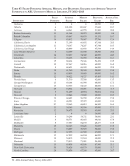
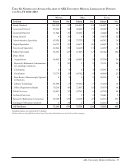
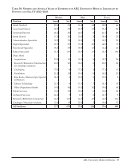
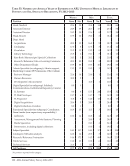
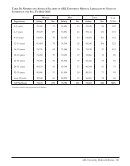
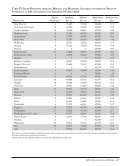
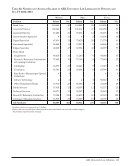
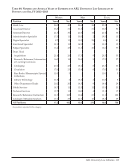
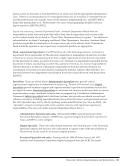
34 · ARL Annual Salary Survey 2012–2013 Filled Positions Average Salaries Median Salaries Beginning Salaries Average Yrs. Exp. Institution FY 2013 FY 2012 FY 2013 FY 2012 FY 2013 FY 2012 FY 2013 FY 2013 Rice 62 65,977 63,227 60,606 58,420 39,300 39,900 16.3 Rochester‡ 68 60,443 61,591 57,633 59,175 40,000 40,000 17.1 Rutgers‡ 84 90,975 94,340 91,735 92,311 50,765 50,765 23.3 Saskatchewan‡ 50 95,083 98,958 90,648 95,637 57,839 60,314 16.3 South Carolina‡ 52 53,874 57,334 50,852 53,643 38,000 38,000 14.7 Southern California‡ 109 78,811 82,956 71,282 74,280 48,500 49,000 21.5 Southern Illinois 32 60,429 60,101 58,032 57,864 44,000 44,000 16.8 SUNY Albany‡ 65 61,846 63,059 59,344 62,073 39,350 39,350 18.5 SUNY Buffalo‡ 65 78,098 77,398 75,000 75,041 47,000 47,000 19.4 SUNY Stony Brook‡ 16 88,464 91,030 80,895 82,583 45,000 45,000 21.4 Syracuse‡ 59 69,794 70,710 62,617 63,957 38,000 38,000 17.6 Temple‡ 46 70,498 71,261 61,978 62,000 44,044 44,044 19.0 Tennessee‡ 42 71,349 72,366 68,576 69,975 48,000 48,000 17.2 Texas‡ 130 65,075 61,037 58,000 55,690 46,000 48,000 15.0 Texas A&M‡ 109 63,266 62,004 58,092 55,696 48,500 49,500 15.1 Texas Tech‡ 67 60,816 63,507 57,936 61,042 49,000 49,000 13.3 Toronto‡ 142 92,487 98,004 90,405 94,940 54,524 56,591 14.3 Tulane 35 65,668 66,266 61,979 62,311 40,000 42,000 17.2 Utah 61 64,334 65,107 58,588 59,583 45,000 46,000 18.2 Vanderbilt‡ 63 62,892 66,294 58,229 60,020 41,500 42,500 20.7 Virginia‡ 74 71,422 72,647 66,600 68,100 47,500 47,500 18.3 Virginia Tech‡ 50 62,578 63,559 59,040 58,800 40,000 40,000 14.6 Washington 111 64,992 64,290 58,704 58,428 42,600 42,600 18.4 Washington State‡ 38 61,505 63,493 59,019 60,000 38,500 39,500 20.0 Washington U.-St. Louis‡ 58 61,093 60,765 55,690 55,825 40,000 40,000 17.8 Waterloo‡ 33 80,968 85,790 81,042 84,910 51,732 53,198 18.2 Wayne State‡ 49 61,219 61,243 58,200 58,200 41,000 45,000 14.5 Western‡ 66 75,958 77,742 74,991 76,208 53,925 54,608 14.5 Wisconsin‡ 148 60,592 62,156 57,385 58,409 40,526 41,336 17.9 Yale 194 81,448 83,157 76,930 78,238 49,500 51,500 18.5 York‡ 58 107,159 104,821 103,896 100,755 48,931 48,819 16.7 Excludes medical and law libraries. See Tables 47 and 57 for comparable figures for medical and law libraries. Directors are included in figures for average years of experience and filled positions, but not in either the average or median salary statistics. † Canadian salaries are expressed in US dollars. See Table 40 for salaries of Canadian librarians expressed in Canadian dollars. ‡ See Footnotes. Table 7: Filled Positions Average, Median, and Beginning Salaries and Average Years of Experience in ARL University Libraries, FY 2012–2013
ARL Annual Salary Survey 2012–2013 Page 34 (34 of 156)


Powered by Tizra® |
Extracted Text (may have errors)
34 · ARL Annual Salary Survey 2012–2013 Filled Positions Average Salaries Median Salaries Beginning Salaries Average Yrs. Exp. Institution FY 2013 FY 2012 FY 2013 FY 2012 FY 2013 FY 2012 FY 2013 FY 2013 Rice 62 65,977 63,227 60,606 58,420 39,300 39,900 16.3 Rochester‡ 68 60,443 61,591 57,633 59,175 40,000 40,000 17.1 Rutgers‡ 84 90,975 94,340 91,735 92,311 50,765 50,765 23.3 Saskatchewan‡ 50 95,083 98,958 90,648 95,637 57,839 60,314 16.3 South Carolina‡ 52 53,874 57,334 50,852 53,643 38,000 38,000 14.7 Southern California‡ 109 78,811 82,956 71,282 74,280 48,500 49,000 21.5 Southern Illinois 32 60,429 60,101 58,032 57,864 44,000 44,000 16.8 SUNY Albany‡ 65 61,846 63,059 59,344 62,073 39,350 39,350 18.5 SUNY Buffalo‡ 65 78,098 77,398 75,000 75,041 47,000 47,000 19.4 SUNY Stony Brook‡ 16 88,464 91,030 80,895 82,583 45,000 45,000 21.4 Syracuse‡ 59 69,794 70,710 62,617 63,957 38,000 38,000 17.6 Temple‡ 46 70,498 71,261 61,978 62,000 44,044 44,044 19.0 Tennessee‡ 42 71,349 72,366 68,576 69,975 48,000 48,000 17.2 Texas‡ 130 65,075 61,037 58,000 55,690 46,000 48,000 15.0 Texas A&M‡ 109 63,266 62,004 58,092 55,696 48,500 49,500 15.1 Texas Tech‡ 67 60,816 63,507 57,936 61,042 49,000 49,000 13.3 Toronto‡ 142 92,487 98,004 90,405 94,940 54,524 56,591 14.3 Tulane 35 65,668 66,266 61,979 62,311 40,000 42,000 17.2 Utah 61 64,334 65,107 58,588 59,583 45,000 46,000 18.2 Vanderbilt‡ 63 62,892 66,294 58,229 60,020 41,500 42,500 20.7 Virginia‡ 74 71,422 72,647 66,600 68,100 47,500 47,500 18.3 Virginia Tech‡ 50 62,578 63,559 59,040 58,800 40,000 40,000 14.6 Washington 111 64,992 64,290 58,704 58,428 42,600 42,600 18.4 Washington State‡ 38 61,505 63,493 59,019 60,000 38,500 39,500 20.0 Washington U.-St. Louis‡ 58 61,093 60,765 55,690 55,825 40,000 40,000 17.8 Waterloo‡ 33 80,968 85,790 81,042 84,910 51,732 53,198 18.2 Wayne State‡ 49 61,219 61,243 58,200 58,200 41,000 45,000 14.5 Western‡ 66 75,958 77,742 74,991 76,208 53,925 54,608 14.5 Wisconsin‡ 148 60,592 62,156 57,385 58,409 40,526 41,336 17.9 Yale 194 81,448 83,157 76,930 78,238 49,500 51,500 18.5 York‡ 58 107,159 104,821 103,896 100,755 48,931 48,819 16.7 Excludes medical and law libraries. See Tables 47 and 57 for comparable figures for medical and law libraries. Directors are included in figures for average years of experience and filled positions, but not in either the average or median salary statistics. † Canadian salaries are expressed in US dollars. See Table 40 for salaries of Canadian librarians expressed in Canadian dollars. ‡ See Footnotes. Table 7: Filled Positions Average, Median, and Beginning Salaries and Average Years of Experience in ARL University Libraries, FY 2012–2013

