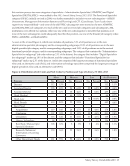
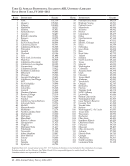
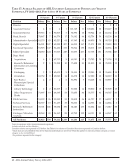
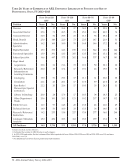
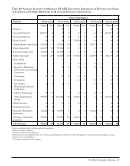
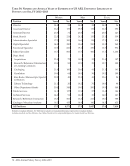
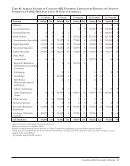
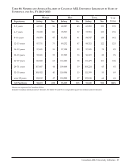
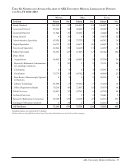
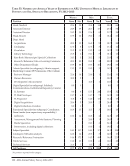
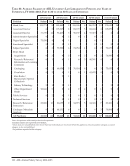
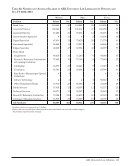
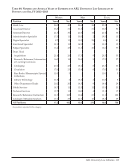
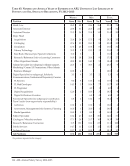
ARL University Medical Libraries · 95 Table 51: Average Salaries of ARL University Medical Librarians by Position and Years of Experience, FY 2012–2013, Part 1: 0 to 19 Years of Experience 0–3 years 4–7 years 8–11 years 12–15 years 16–19 years Position Salary No. Salary No. Salary No. Salary No. Salary No. Head, Medical .‡ 1 ‡ 1 ‡ 1 128,432 6 Associate Director .‡ 1 70,106 4 91,140 5 88,593 7 Assistant Director ‡ 2 ‡ 3 ‡ 3 74,709 4 ‡ 3 Head, Branch ‡ 1 56,924 4 ‡ 3 68,664 4 ‡ 2 Administrative Specialist ‡ 3 ‡ 3 ‡ 3 ‡ 3 75,162 4 Digital Specialist 68,823 4 55,936 16 66,694 11 65,999 19 60,899 10 Functional Specialist 55,869 7 55,608 7 ‡ 3 ‡ 3 61,116 7 Subject Specialist 54,540 15 61,117 39 62,796 21 72,478 13 72,534 10 Dept. Head Acquisitions ‡ 2 ‡ 3 61,805 4 ‡ 3 .Research/Reference/ Information or Learning Commons ‡ 1 ‡ 1 61,822 4 ‡ 3 85,498 5 Cataloging ‡ 2 ‡ 1 ‡ 1 ‡ 1 ‡ 1 Circulation .‡ 2 68,884 4 75,300 4 60,648 4 Rare Books/ Manuscripts/Special Collections .‡ 1 ‡ 1 ‡ 1 ‡ 1 Library Technology .‡ 3 .‡ 2 ‡ 2 Other Department Heads 47,029 5 65,485 5 59,223 5 64,433 7 79,826 8 Public Services 56,461 5 57,028 9 64,292 7 64,516 6 ‡ 2 Technical Services .‡ 3 ‡ 1 ..Research/Reference/ Instruction 53,988 37 54,185 44 65,133 24 69,756 25 73,591 23 Cataloger/Metadata Analysts ‡ 2 63,547 5 ‡ 1 ‡ 2 ‡ 2 All Positions: 55,128 86 59,141 151 64,054 101 69,240 106 76,138 97 Years of experience reflect total professional experience. Canadian salaries are expressed in US dollars. ‡ Salary data are not published when fewer than four individuals are involved. When this applies to only one position category, a second category is also not published. .No positions reported in this category.
Help