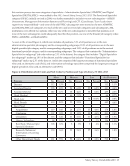
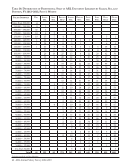
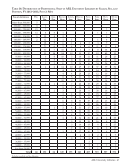
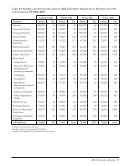
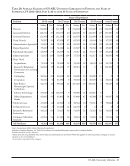
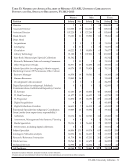
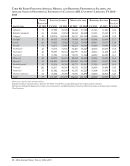
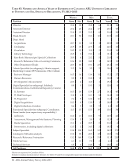
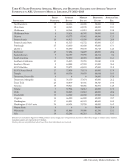
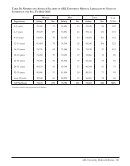
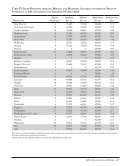
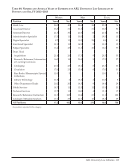
54 · ARL Annual Salary Survey 2012–2013 Table 22: Number and Average Salaries of ARL University Librarians by Years of Experience and Sex, FY 2012–2013 Women Men Total %of Total Experience Salary No. Salary No. Salary No. 0–3 years 55,042 471 58,895 263 56,423 734 9% 4–7 years 58,787 809 59,992 440 59,212 1,249 15% 8–11 years 65,012 683 68,051 442 66,206 1,125 13% 12–15 years 70,796 691 72,970 469 71,675 1,160 14% 16–19 years 76,375 502 79,971 321 77,777 823 10% 20–23 years 78,967 469 82,457 310 80,356 779 9% 24–27 years 83,261 498 88,675 288 85,245 786 9% 28–31 years 87,872 402 89,111 219 88,309 621 7% 32–35 years 95,101 322 100,606 211 97,280 533 6% over 35 years 102,462 402 109,999 199 104,957 601 7% All Positions: 74,449 5,249 77,669 3,162 75,660 8,411 100% Excludes medical and law libraries. See Tables 56 and 66 for comparable figures for medical and law libraries. Canadian salaries are expressed in US dollars. See Table 46 for salaries of Canadian librarians expressed in Canadian dollars.
Help